How to Pivot Tables in SQL
Pivoting tables in SQL is a common task for programmers, database administrators (DBAs), data analysts or anyone else querying SQL databases. In SQL, a pivot is used to transform (or pivot) rows of data into columns to generate insights from our data.
Let’s learn how to pivot a table in SQL. We will illustrate how to perform an SQL pivot with an easy-to-understand example.
Why Do We Need to Pivot Tables in SQL?
SQL databases store data in columns and rows. Columns are referred to as fields, and rows as records. Oftentimes, we want to change the way our data is presented to us or our stakeholders. Pivot tables are a tool used for summarizing data and generating insights from it. They are a critical feature in reporting, business intelligence or analysis and let us present data in a more readable, quicker-to-understand format.

Pivot Tables in SQL
Let’s design a database for global smartphone sales to better understand how pivoting tables can help us extract insights from our dataset.
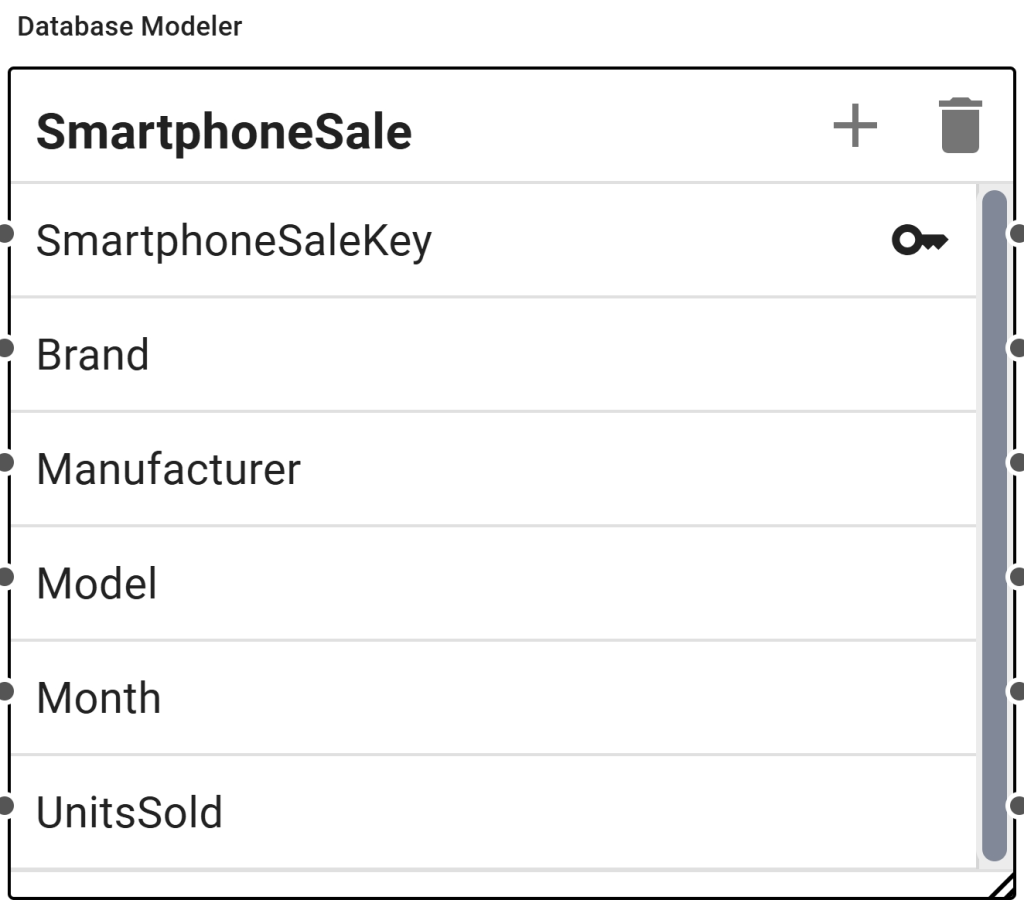
Our database has five fields (and many more in reality):
- GUID, which serves as the table’s Primary Key. For the sake of simplicity, let’s use simple numbers as the primary key.
- Brand
- Manufacturer
- Model
- Month
- Units Sold
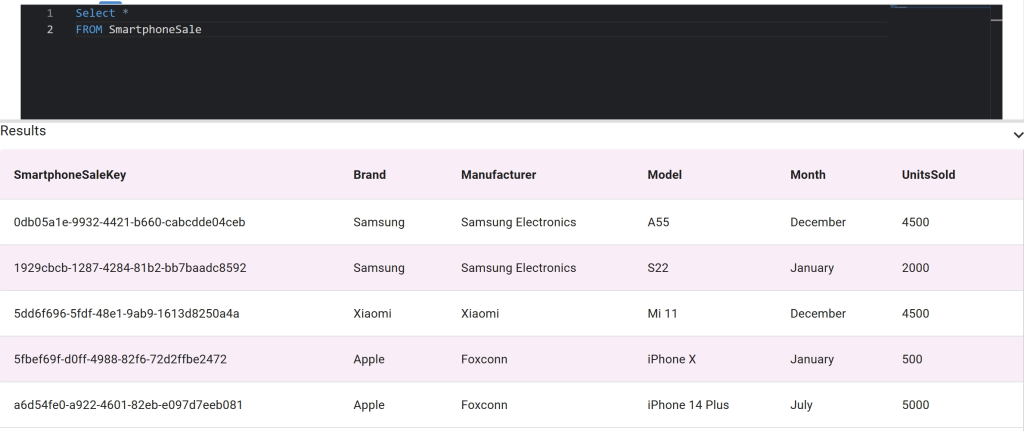
Here is what our database table would look like with five records in it:
| GUID | Brand | Manufacturer | Model | Month | Units Sold |
| 1 | Apple | Foxconn | iPhone X | January | 500 |
| 2 | Samsung | Samsung Electronics | S22 | January | 2000 |
| 3 | Xiaomi | Xiaomi | Mi 11 | December | 4500 |
| 4 | Apple | Foxconn | iPhone 14 Plus | July | 5000 |
| 5 | Samsung | Samsung Electronics | A55 | December | 4500 |
Even with a small dataset like this, it is difficult to figure out the total monthly number of units sold by model. By pivoting our table, we can create a data view that shows monthly sales by model.
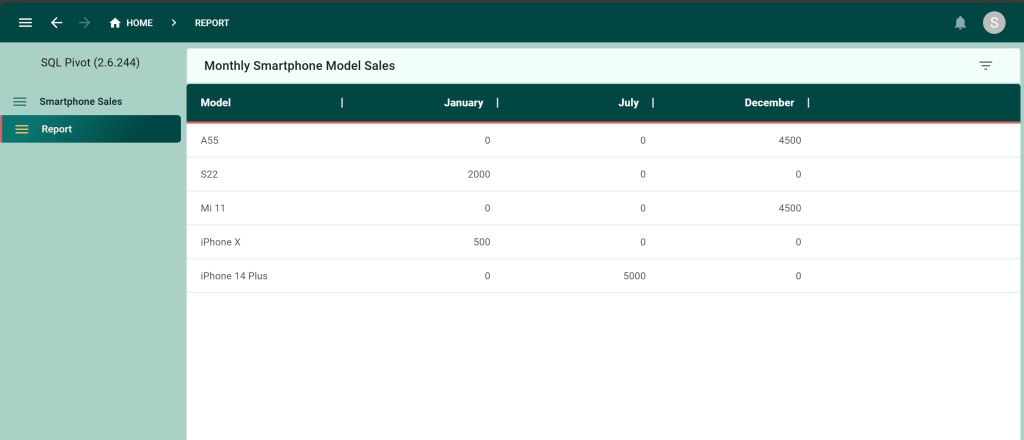
Here’s what we would like our final result to look like. By pivoting our tables, we have moved our month records into the column names, transforming rows into columns. We can now clearly see which model is the best-selling smartphone model by month.

Here are the steps we took:
Step 1: We created a simple database table for smartphone sales.

Step 2. We populated the table with the dummy data shown above. Here’s what our table looks like when writing a SELECT * statement.

Step 3. To see each model’s monthly sales we wrote this SQL query, which pivots the table.
SELECT
  `SmartphoneSale`.`Model` As Model,
  SUM(CASE WHEN month = 'January' THEN UnitsSold ELSE 0 END) AS January,
  SUM(CASE WHEN month = 'July' THEN UnitsSold ELSE 0 END) AS July,
  SUM(CASE WHEN month = 'December' THEN UnitsSold ELSE 0 END) AS December
FROM
  `SmartphoneSale`
GROUP BY Model
In this query, we first select each model and then ask SQL to sum up monthly sales by using a CASE statement for each month in our dataset. The corresponding output is exactly what we wanted: a list of smartphones and their monthly sales.
Creating a Web Front End For a SQL Database
We used Five to create the database and write the SQL query above. Five is a rapid application development environment for creating data-driven business software. Each app developed in Five comes with its own MySQL database and an auto-generated admin panel front-end.
Here’s what our SQL pivot query looks like as a data view in our app.

Five is the fastest way to go from database to web app. Sign up for a free trial to start developing today here.


