Calculating... until our next FREE Code-Along Session. Secure your spot now

Create a Data Visualization Tool

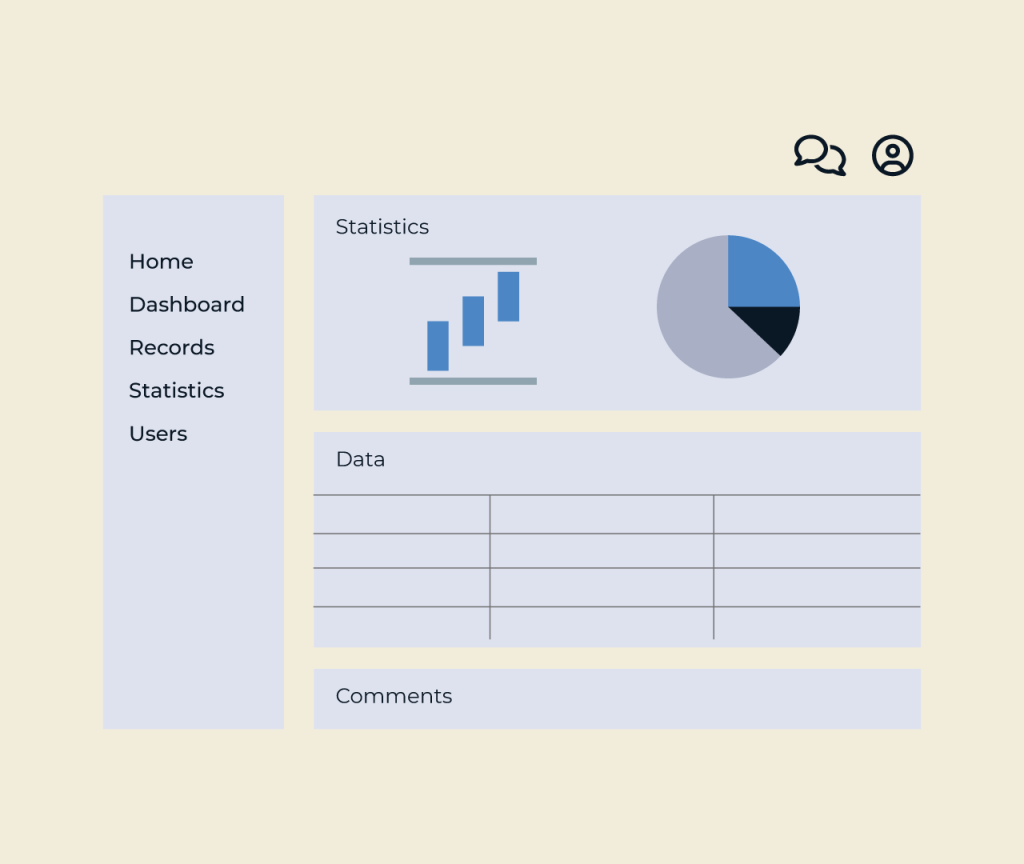
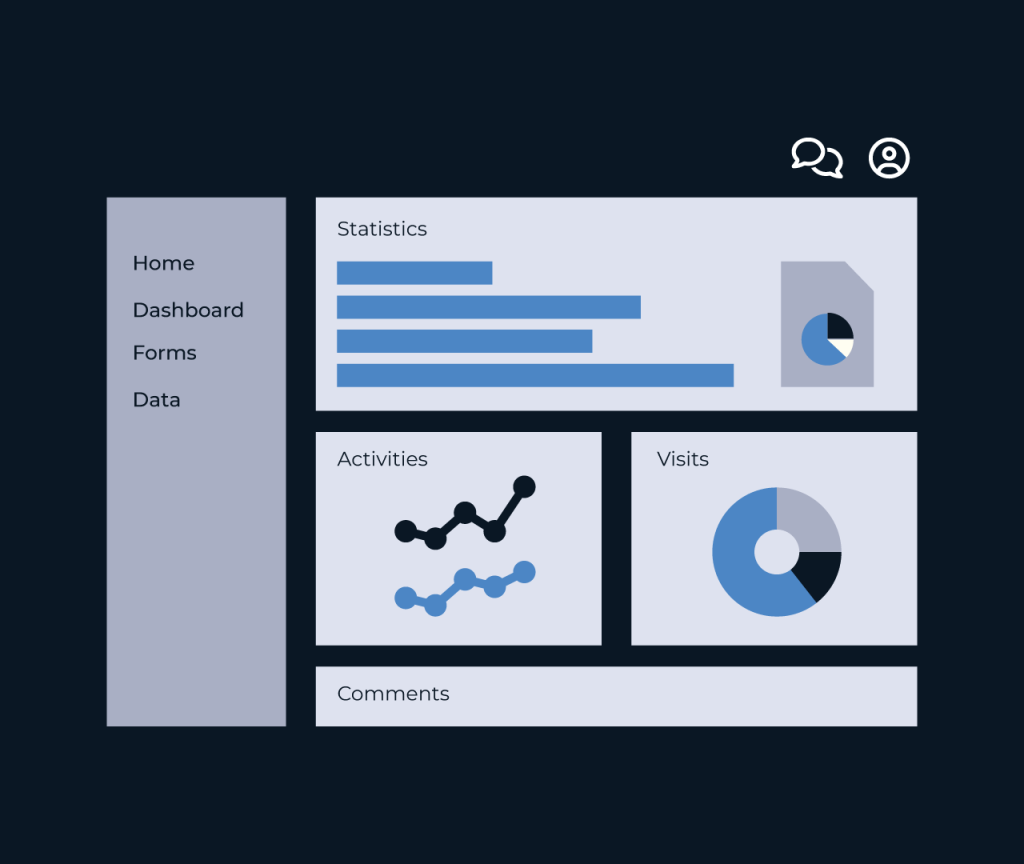
Creating a data visualization tool is essential for transforming complex datasets into understandable insights. Five empowers users to effortlessly build custom visualizations, combining various data points with engaging graphics. Its user-friendly interface enables both novices and experts to design intuitive dashboards tailored to specific needs.

With flexible integration options, Five allows you to connect seamlessly to diverse data sources, including APIs and databases. Users can choose from a wide array of chart types, apply filters, and customize themes, ensuring that every visualization effectively communicates its message. Explore the power of data visualization and make informed decisions with Five’s innovative tools.

Don’t want to go through the hassle of building it yourself? Our team of developers will develop a prototype solution in 2 to 4 weeks – at a fraction of the cost of other providers and completely tailored to you.

Get Started Built For You?

Build Yourself vs Built For You

Build it Yourself Using Five

You can build it yourself using Five, a development environment designed for rapid application creation. Equipped with intuitive tools, Five makes development faster, though there is a learning curve, and complex applications still take time to fully develop. If you need a simple solution, Five is a great choice. But for more advanced requirements, Option 2 might be a better fit.

We Build It For You

Our experienced development team builds your application using Five. By using the Five platform, our team can convert requirements into working software 10x faster than traditional approaches to software engineering. When working with us, our clients see working software almost immediately.

Data Visualization Tool FAQ's

A data visualization tool helps to present complex data in a clear and accessible way. It transforms raw data into visual formats like charts, graphs, and maps, making it easier to understand patterns, trends, and insights at a glance. These tools are essential for decision-making, as they allow users to quickly grasp significant information without sifting through numerous spreadsheets or reports. By visualizing data, organizations can communicate their findings effectively and facilitate better collaboration among team members.

Data visualization tools are used by a wide range of professionals across various industries. Business analysts leverage these tools to derive insights from complex datasets, while marketers use them to track campaign performance and customer trends. Data scientists and researchers also rely on visualizations to present their findings clearly and compellingly. Additionally, educators and students utilize data visualization to enhance learning and comprehension of statistical concepts. Even executives benefit from these tools to make informed decisions based on data-driven insights. Overall, anyone who needs to make sense of data can find value in a data visualization tool.

Five is designed to help you rapidly build and deploy modern data-driven applications, making it ideal for creating a data visualization tool. With its ability to integrate with various data sources, including MySQL and RESTful APIs, you can easily retrieve and process data to generate insightful dashboards, charts, and reports. Additionally, Five simplifies the development process with visual database building and a user-friendly query builder, allowing you to focus on the data itself rather than getting caught up in complex coding. Its one-click deployment ensures that your application is quickly accessible, enabling you to share your visualizations effortlessly.

When developing a data visualization tool, it is vital to collect comprehensive user requirements. Understanding the target audience and their specific needs will guide the design and functionality. Gathering information on the types of data users want to visualize, their preferred visualization styles, and the insights they aim to extract is essential. Additionally, considering the technical environment is crucial. Assessing data sources, formats, and the level of interactivity desired will enhance usability. Collecting feedback throughout the development process will ensure the tool effectively meets user expectations and fosters better data-driven decision-making.

Why Five Is Great For Data Visualization Tools

Integration and Scalability

Five is a robust web platform perfect for creating data visualization tools. It integrates seamlessly with external databases and APIs, allowing you to pull in data from CRM, ERP, and other systems. With support for MySQL, PostgreSQL, and MS SQL Server, you can easily visualize and manipulate data. Its user-friendly interface enables quick development of charts and dashboards, helping you turn raw data into actionable insights effortlessly. Whether for internal reporting or external client presentations, Five streamlines the entire process, from data management to stunning visualizations.

Flexibility and Customization

Five offers unparalleled flexibility and customization for creating data visualization tools. With an intuitive interface, you can effortlessly build and design dashboards, charts, and reports tailored to your specific needs. The platform's integration capabilities allow you to connect with various data sources, while role-based access ensures that sensitive information remains secure. Whether you have coding experience or not, Five empowers you to visualize your data creatively and effectively, making it the ideal solution for businesses seeking customized insights.

Build With Speed

Five significantly accelerates the development of data visualization tools compared to traditional approaches, which often involve lengthy coding and rigid frameworks. With its intuitive, no-code interface, visual database modeling, and built-in charting features, users can quickly create dynamic dashboards and reports. Traditional methods require extensive integration efforts and manual coding, whereas Five streamlines these processes with automation, role-based access, and seamless deployment. This allows developers to focus on insights and user experience, ultimately reducing development time and increasing efficiency.

Five Co Use Cases

Quick Guide to Creating a Data Visualization Tool

In this tutorial, we will build a simple Data Visualization Tool using the Five development environment. Follow these three main steps to create a responsive web app that integrates data visualization features.

Step 1: Create a New Application

1.1 Click on Applications in Five.

1.2 Click the yellow Plus icon to create a new app.

1.3 Name your app and save it.

Step 2: Set Up Your Database

2.1 Once your app is created, go to Data > Table Wizard to create necessary database tables like Products, Orders, and their relationships.

2.2 Use the Database Modeler to visualize and ensure your tables are correctly linked.

Step 3: Create Data Visualizations

3.1 Write SQL queries that will pull data for visualization.

3.2 Utilize the Chart Wizard in Five to create charts based on your SQL query.

3.3 Finally, set up menus to access these visualizations within your app.

And there you have it! A basic Data Visualization Tool built in just a few steps using Five.


Centered Text


What More Can You Do With Five?

From project management tools, progress tracking apps, customer portals, and performance dashboards to functional CRUD apps, Five helps you build and deploy faster.


Start developing your first application!

Get Started For Free Today

Sign Up Free Book a demo

Build Your Web App With Five

200+ Free Trials Started This Week

Start Free

Thank you for your message!

Our friendly staff will contact you shortly.

CLOSE