Calculating... until our next FREE Code-Along Session. Secure your spot now

Create a Financial Reporting Dashboard

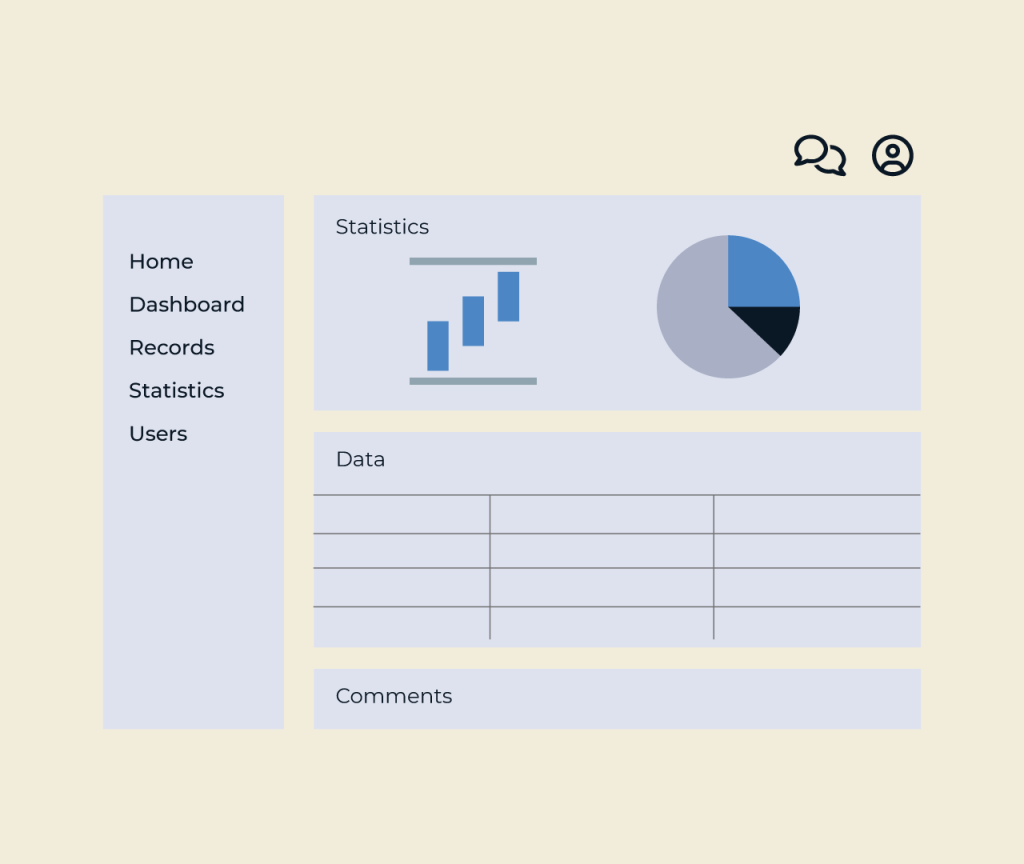
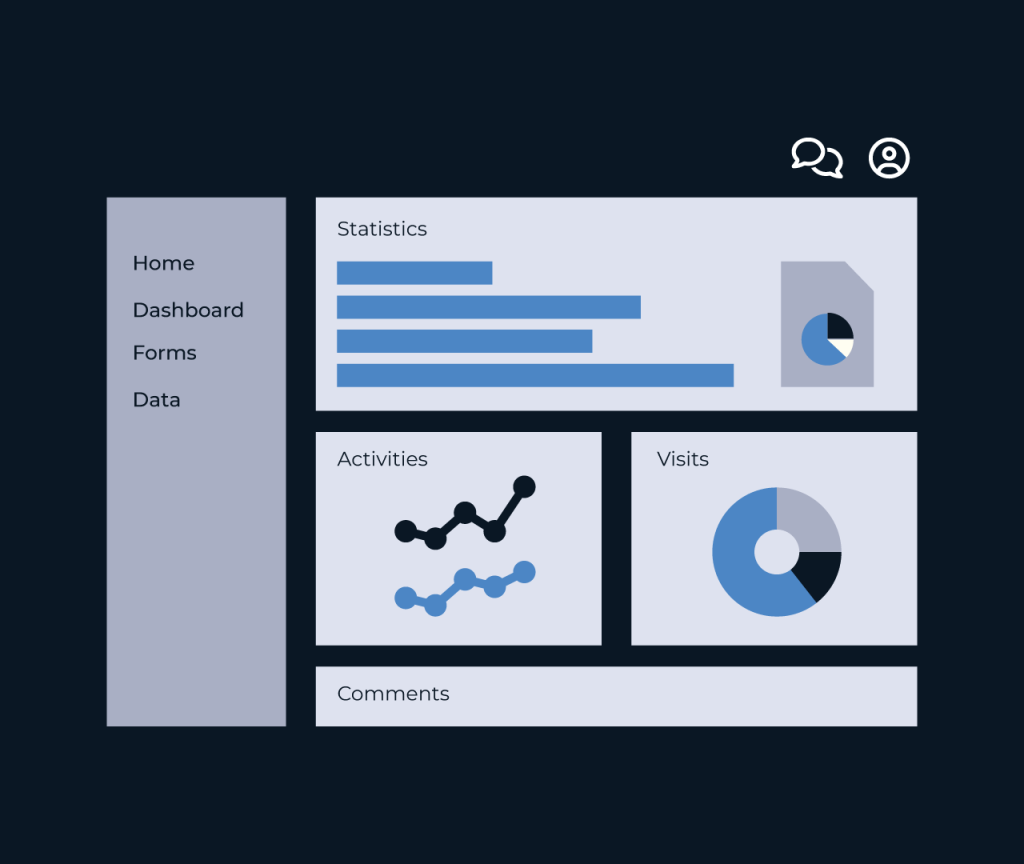
Creating a financial reporting dashboard is essential for effective data visualization and decision-making. With Five, you can easily compile key financial metrics and present them in a user-friendly interface. This platform enables you to customize your dashboard by selecting relevant data points, charts, and graphs that suit your reporting needs.

Five’s intuitive drag-and-drop functionality allows users to arrange and design their dashboards effortlessly. By aggregating real-time data, it ensures that you have the most up-to-date information at your fingertips. This powerful tool not only simplifies financial analysis but also enhances collaboration among stakeholders, fostering informed decisions for your organization.

Don’t want to go through the hassle of building it yourself? Our team of developers will develop a prototype solution in 2 to 4 weeks – at a fraction of the cost of other providers and completely tailored to you.

Get Started Built For You?

Build Yourself vs Built For You

Build it Yourself Using Five

You can build it yourself using Five, a development environment designed for rapid application creation. Equipped with intuitive tools, Five makes development faster, though there is a learning curve, and complex applications still take time to fully develop. If you need a simple solution, Five is a great choice. But for more advanced requirements, Option 2 might be a better fit.

We Build It For You

Our experienced development team builds your application using Five. By using the Five platform, our team can convert requirements into working software 10x faster than traditional approaches to software engineering. When working with us, our clients see working software almost immediately.

Financial Reporting Dashboard FAQ's

Five is an excellent solution for creating a financial reporting dashboard. With its ability to connect to multiple data sources, you can effortlessly aggregate financial data from various systems. The platform’s user-friendly SQL query builder allows you to extract and manipulate data to generate insightful reports and charts. Additionally, Five’s predefined user interfaces enable you to build a responsive dashboard quickly. You can customize the look and feel to match your business branding without needing extensive front-end skills. The straightforward deployment features ensure that your dashboard is secure and readily accessible to all stakeholders.

When creating a financial reporting dashboard, it is essential to gather key metrics that accurately reflect the organization's financial health. Start with revenue figures, expenses, profit margins, and cash flow. You should also track accounts receivable and payable, as well as key performance indicators that align with your business goals. Additionally, historical data is vital for trends and forecasting. Ensure you include budget variances to see how actual performance compares to projections. Finally, consider adding visual elements like charts and graphs to make the information easily digestible and actionable for stakeholders.

A financial reporting dashboard serves as a visual tool that consolidates key financial metrics and data in one place. Its main purpose is to provide quick access to essential information, making it easier for stakeholders to monitor financial performance and make informed decisions. By presenting data in an organized manner, the dashboard helps identify trends, track goals, and spot potential issues. This allows businesses to respond proactively to financial challenges and opportunities, ultimately supporting better strategic planning and resource allocation.

A financial reporting dashboard will be useful for various stakeholders within an organization. Executives and managers can use it to get a quick overview of financial performance, helping in strategic decision-making. Accountants and finance teams rely on it for detailed reports and analysis, allowing them to monitor budgets and expenditures effectively. Additionally, investors and board members may use the dashboard to track financial health and ensure that the organization is meeting its goals. Even external auditors can benefit from the streamlined access to financial data, simplifying their review and verification processes.

Why Five Is Great For Financial Reporting Dashboards

Flexibility and Customization

Five offers unparalleled flexibility for creating customizable financial reporting dashboards. With its intuitive, low-code platform, you can design dashboards tailored to your specific needs, integrating data from MySQL or MS SQL Server seamlessly. The visual modeling tools and dynamic form capabilities allow you to create user-friendly interfaces that adapt to your business requirements, ensuring you have real-time insights at your fingertips. Plus, with built-in role-based access and security features, your sensitive financial data remains protected and accessible only to authorized users.

Build With Speed

Five accelerates the creation of financial reporting dashboards by integrating database management and rapid application development into a single platform, unlike traditional methods that often rely on extensive coding and disparate tools. While older approaches require manual data handling and lengthy development cycles, Five's intuitive interface, visual design capabilities, and built-in SQL support streamline the process. Its features, such as role-based access and external service integration, enable faster deployment and enhanced security, making it ideal for quickly developing robust financial applications.

Integration and Scalability

Five makes it easy to build a Financial Reporting Dashboard by seamlessly integrating with various business systems like CRM and ERP through RESTful APIs and direct database connections. With its robust database management, you can pull data from multiple sources, ensuring accurate and comprehensive reporting. The platform’s intuitive interface allows for quick customization of charts and reports, making it easy to adapt to changing business needs. This flexibility and scalability enable users to track financial performance in real-time, enhancing decision-making and insights.

Five Co Use Cases

Quick Guide to Creating a Financial Reporting Dashboard

Follow this three-step guide to build a Financial Reporting Dashboard using Five.

Step 1: Set Up Your Database

1. Start by creating a new application in Five and set up a MySQL database.
2. Use the Table Wizard to create tables for financial data, such as Transactions, Accounts, and Categories.
3. Establish relationships between your tables, ensuring a smooth flow of data for reporting.

Step 2: Create Forms and Queries

1. Utilize the Form Wizard to create user-friendly forms for data entry and updates.
2. Build SQL queries to extract relevant financial data needed for your dashboard, grouping and filtering information as required.
3. Validate input data to ensure accuracy and consistency in your reports.

Step 3: Visualize Data with Charts and Reports

1. Use the Chart Wizard to create visual representations of your financial data, such as bar graphs for revenue over time.
2. Generate PDF reports summarizing key financial metrics.
3. Integrate these visual elements into your application’s menu, providing users easy access to insights and analytics.

By following these steps, you can quickly develop a functional Financial Reporting Dashboard with Five!


Centered Text


What More Can You Do With Five?

From project management tools, progress tracking apps, customer portals, and performance dashboards to functional CRUD apps, Five helps you build and deploy faster.


Start developing your first application!

Get Started For Free Today

Sign Up Free Book a demo

Build Your Web App With Five

200+ Free Trials Started This Week

Start Free

Thank you for your message!

Our friendly staff will contact you shortly.

CLOSE