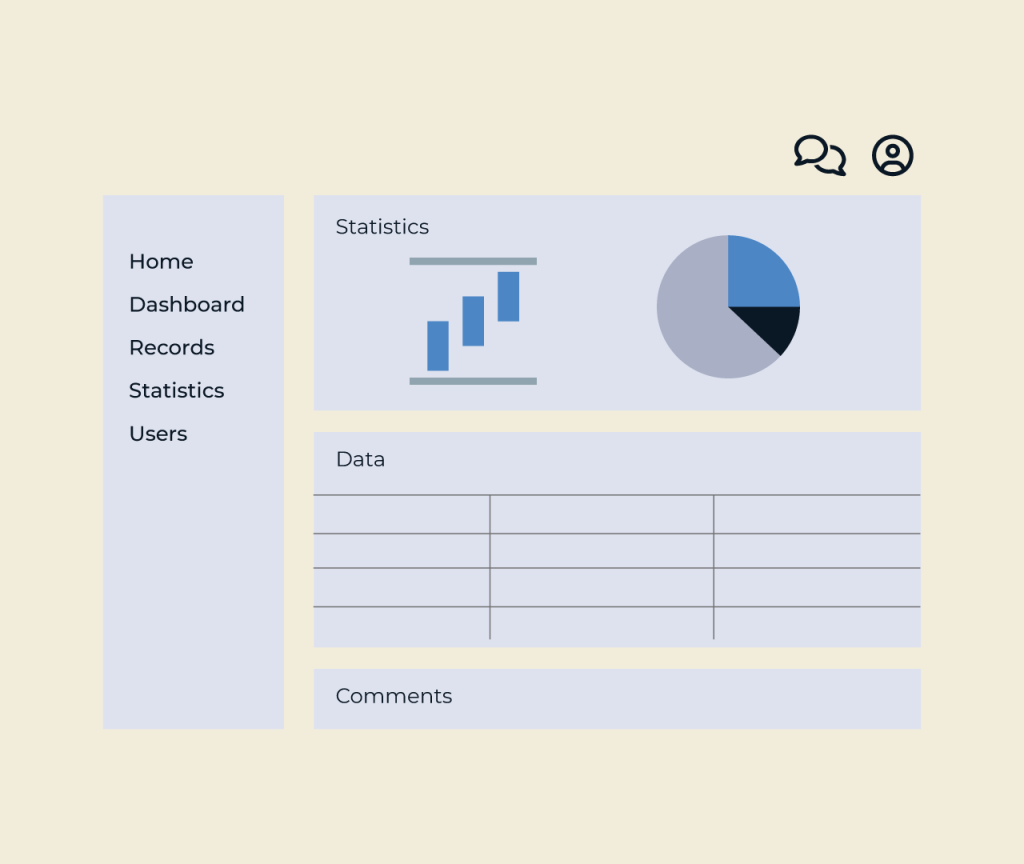
Creating a website analytics dashboard is essential for tracking performance and understanding user behavior. With Five, you can effortlessly build a customized dashboard that consolidates key metrics, such as traffic sources, user engagement, and conversion rates. Its user-friendly interface allows you to visualize data in real-time, empowering you to make informed decisions.
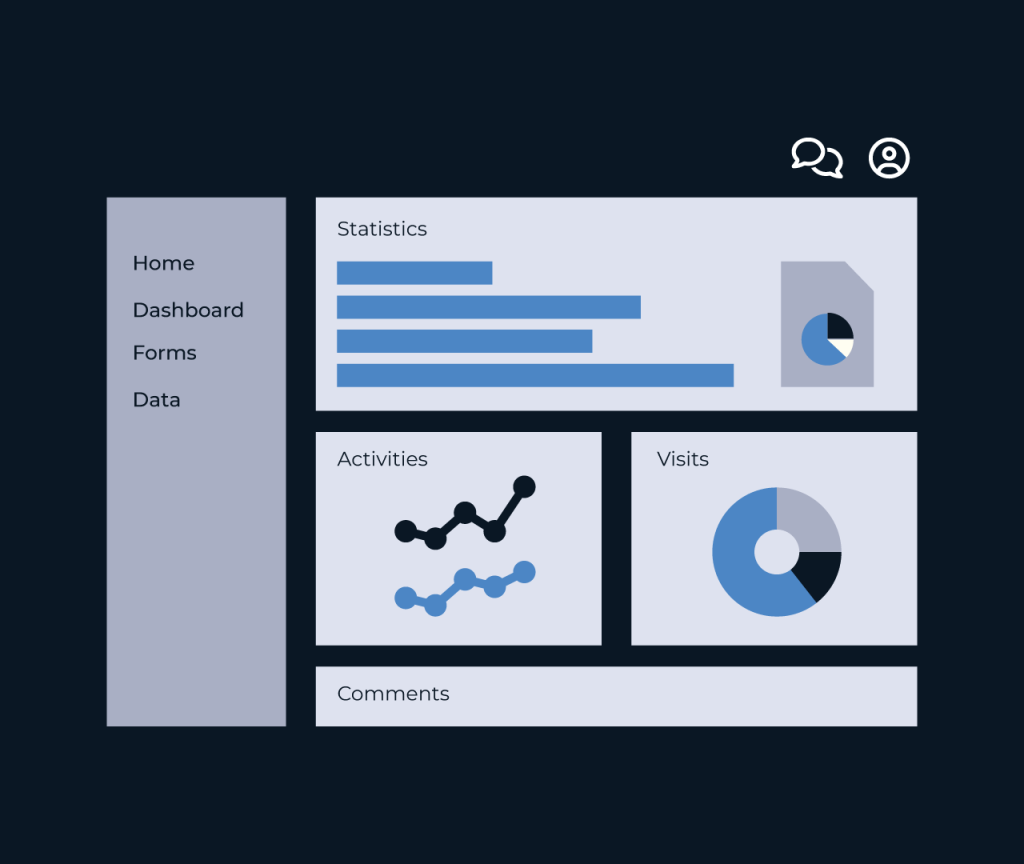
Five provides powerful integration options with popular analytics tools, enabling you to gather insights from multiple sources in one place. By leveraging its interactive elements and customizable widgets, you can tailor your dashboard to reflect your unique business goals, helping you optimize strategies and enhance user experience effectively.
You can build it yourself using Five, a development environment designed for rapid application creation. Equipped with intuitive tools, Five makes development faster, though there is a learning curve, and complex applications still take time to fully develop. If you need a simple solution, Five is a great choice. But for more advanced requirements, Option 2 might be a better fit.
Our experienced development team builds your application using Five. By using the Five platform, our team can convert requirements into working software 10x faster than traditional approaches to software engineering. When working with us, our clients see working software almost immediately.
Website analytics dashboards will be used by a variety of individuals and teams, including marketers, business owners, web developers, and content creators. These users rely on the data to understand user behavior, track campaign performance, and make informed decisions about website improvements. Additionally, data analysts will utilize the dashboards to extract insights and generate reports. Executives may also refer to these dashboards for high-level overviews of website performance and growth trends. Ultimately, anyone involved in online strategies or website management can benefit from the insights provided by an analytics dashboard.
Five is an excellent platform for creating a website analytics dashboard because it allows you to quickly build applications using its user-friendly interface. With built-in MySQL database capabilities, you can easily manage your data and create custom queries in SQL to extract insights. The platform supports seamless integration with multiple data sources and enables you to visualize your data through charts and dashboards. Additionally, Five’s automation features let you streamline workflows and set up notifications, making it ideal for tracking website performance and user behavior efficiently.
When creating a website analytics dashboard, it is essential to collect key information that provides insights into user behavior. Start with metrics like page views, unique visitors, and bounce rate. These figures help you understand traffic patterns and user engagement, which is vital for improving your content and user experience. Additionally, consider tracking conversion rates, user demographics, and sources of traffic. Knowing where your visitors come from and who they are can guide your marketing strategies. Monitoring these elements can lead to better decision-making and a more effective website overall.
A website analytics dashboard serves as a central hub for tracking and visualizing important metrics about a website's performance. It consolidates data such as visitor numbers, traffic sources, and user behavior, making it easier for website owners to understand how their site is used. By analyzing this data, businesses can identify trends, optimize content, and improve user experience. The dashboard helps in making informed decisions to enhance marketing strategies, boost engagement, and ultimately drive conversions, contributing to the overall success of the website.
In this 3-step guide, we’ll walk you through the basics of building a Website Analytics Dashboard using the Five development environment. Let’s get started!
To kick off your project, navigate to the Applications section and click on the Plus icon to create a new application. Title it Website Analytics Dashboard and save your progress.
Utilize the Data > Table Wizard to create vital database tables such as Users, PageViews, and Sessions. Define necessary fields like UserID, PageURL, and VisitDate. Ensure relationships between tables where applicable.
Use the Visual > Chart Wizard to create insightful charts representing your analytics data. You can generate line charts for user sessions over time, pie charts for traffic source distribution, or bar charts for page views. Finally, integrate these visualizations into your main navigation menu for easy accessibility.
With these steps, you’ve set up a fundamental Website Analytics Dashboard that showcases your site’s performance metrics beautifully!
From project management tools, progress tracking apps, customer portals, and performance dashboards to functional CRUD apps, Five helps you build and deploy faster.