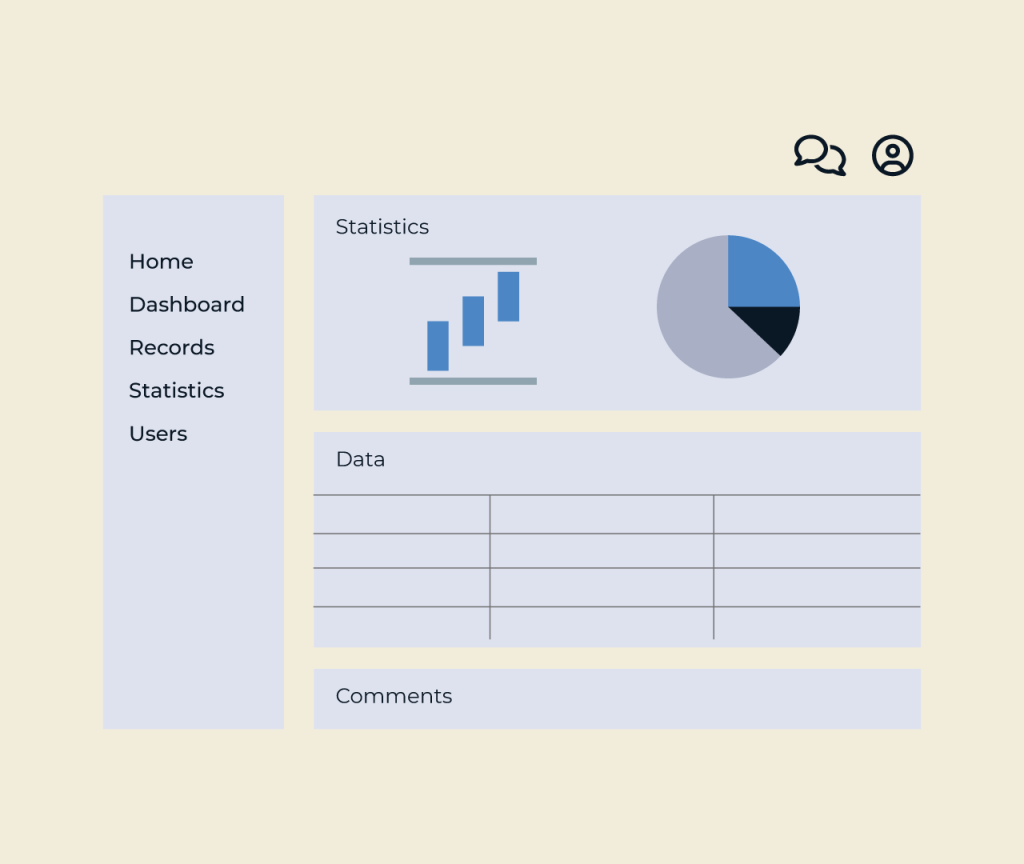
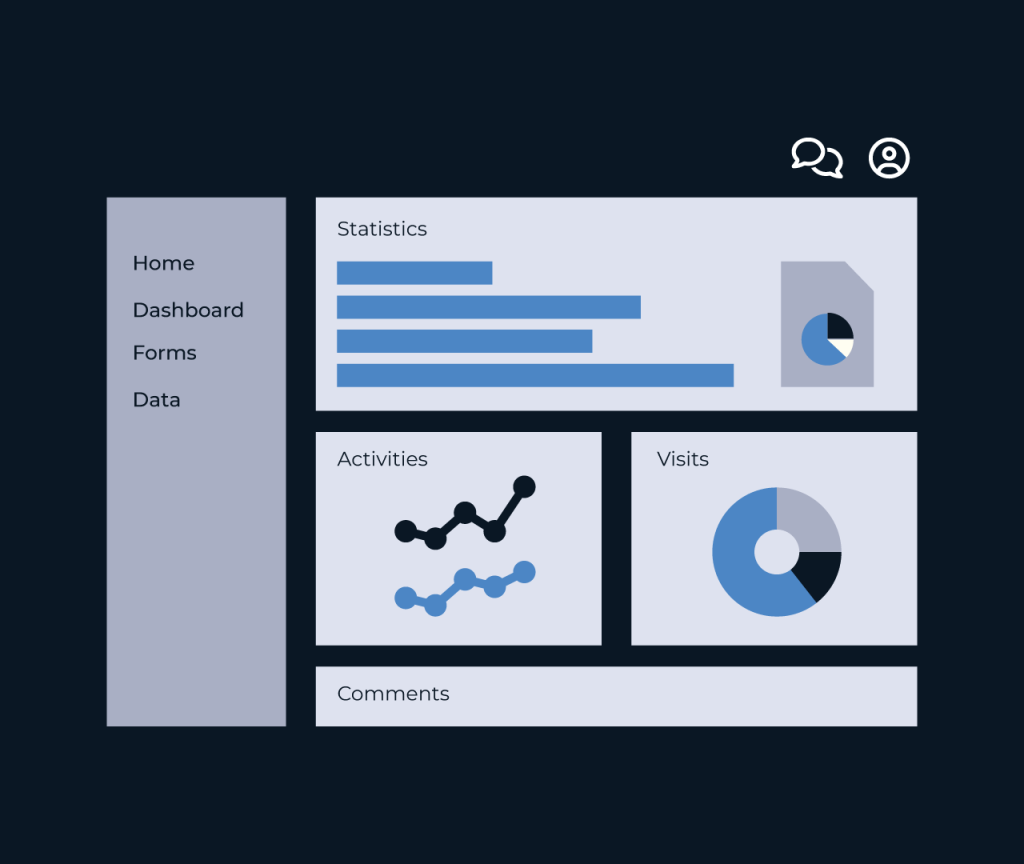
Creating a custom reporting dashboard with Five is a seamless experience, tailored to meet your specific business needs. Users can easily select from a variety of data sources and metrics, enabling them to track key performance indicators (KPIs) relevant to their operations. This flexibility ensures that each dashboard is unique and directly aligned with company objectives.
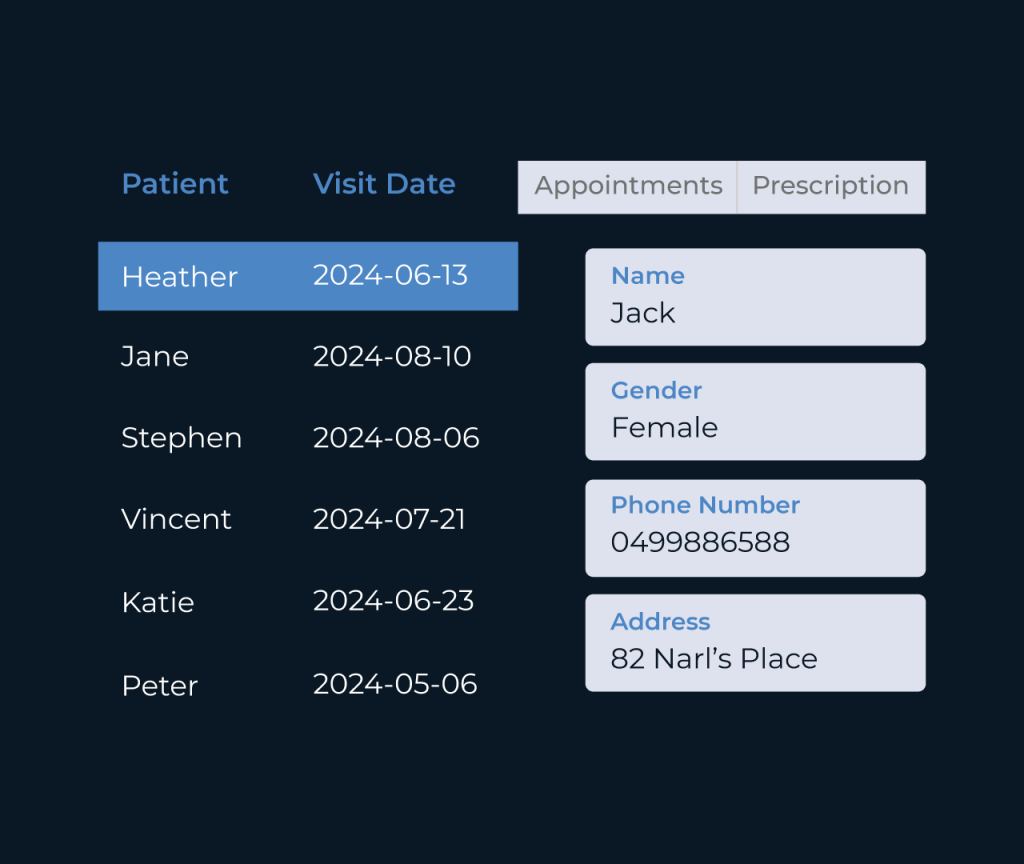
Five’s intuitive interface allows for drag-and-drop functionality, making it simple to rearrange elements and customize visualizations. With real-time data updates, businesses can make informed decisions quickly, enhancing efficiency and responsiveness. This empowerment fosters a data-driven culture, driving growth and strategic advancements.
You can build it yourself using Five, a development environment designed for rapid application creation. Equipped with intuitive tools, Five makes development faster, though there is a learning curve, and complex applications still take time to fully develop. If you need a simple solution, Five is a great choice. But for more advanced requirements, Option 2 might be a better fit.
Our experienced development team builds your application using Five. By using the Five platform, our team can convert requirements into working software 10x faster than traditional approaches to software engineering. When working with us, our clients see working software almost immediately.
When creating a custom reporting dashboard, the most important information to collect includes key performance indicators that align with your business objectives. You should identify the metrics that matter most, such as sales figures, customer engagement data, and operational efficiency. This will help you measure progress effectively. Additionally, understanding your audience is crucial. Consider who will be using the dashboard, what decisions they need to make, and how they prefer to visualize data. Gathering user feedback during the development process can ensure the dashboard meets their needs and provides actionable insights.
A custom reporting dashboard serves to centralize and visualize data that matters most to a specific business or project. It helps users track key performance indicators and metrics in real time, making it easier to identify trends and insights that drive decision-making. Additionally, by tailoring the dashboard to individual needs, teams can focus on relevant information without the clutter of unnecessary data. This streamlined access allows for quicker analysis and better collaboration, ultimately enhancing efficiency and productivity in achieving goals.
A custom reporting dashboard will be used by various stakeholders within an organization. This includes management teams who need to track key performance indicators, analysts looking for data insights, and department heads who want to monitor their teams’ progress. Additionally, marketing and sales teams may utilize these dashboards to analyze campaign effectiveness and customer engagement. Employees across different levels can benefit from the dashboard’s personalized views, which allow them to focus on the metrics most relevant to their roles. Ultimately, anyone requiring data to make informed decisions will find value in a custom reporting dashboard.
Five simplifies the process of creating a custom reporting dashboard by allowing you to rapidly build and deploy applications using its intuitive visual tools. You can create and manage a MySQL database, easily connect to multiple data sources, and run SQL queries to generate insightful reports and dashboards in a fraction of the time. With built-in templates and a responsive design, your dashboard will look professional on any device. Five's AI features assist in debugging and optimizing your code, ensuring a smooth development experience while providing full control over the application's custom logic and user permissions.
Creating a custom reporting dashboard in Five can be achieved in just three simple steps:
Utilize the Table Wizard to establish the necessary tables for your reporting dashboard. This may include tables for your data sources, user metrics, and any statistics required for your reports.
Write SQL queries using Five’s data query feature to fetch relevant data from your tables. Make sure to structure your queries to allow for reporting metrics that your stakeholders need.
Utilize the Chart and Reports Wizards to create visualizations and reports that represent your data clearly. Configure the user interface to present these in a user-friendly manner, integrating with any additional features or notifications as necessary.
By following these steps, you will build an effective custom reporting dashboard that meets your project needs using Five!
From project management tools, progress tracking apps, customer portals, and performance dashboards to functional CRUD apps, Five helps you build and deploy faster.