Rapidly Build and Deploy Interactive Data Visualization Dashboards With Five
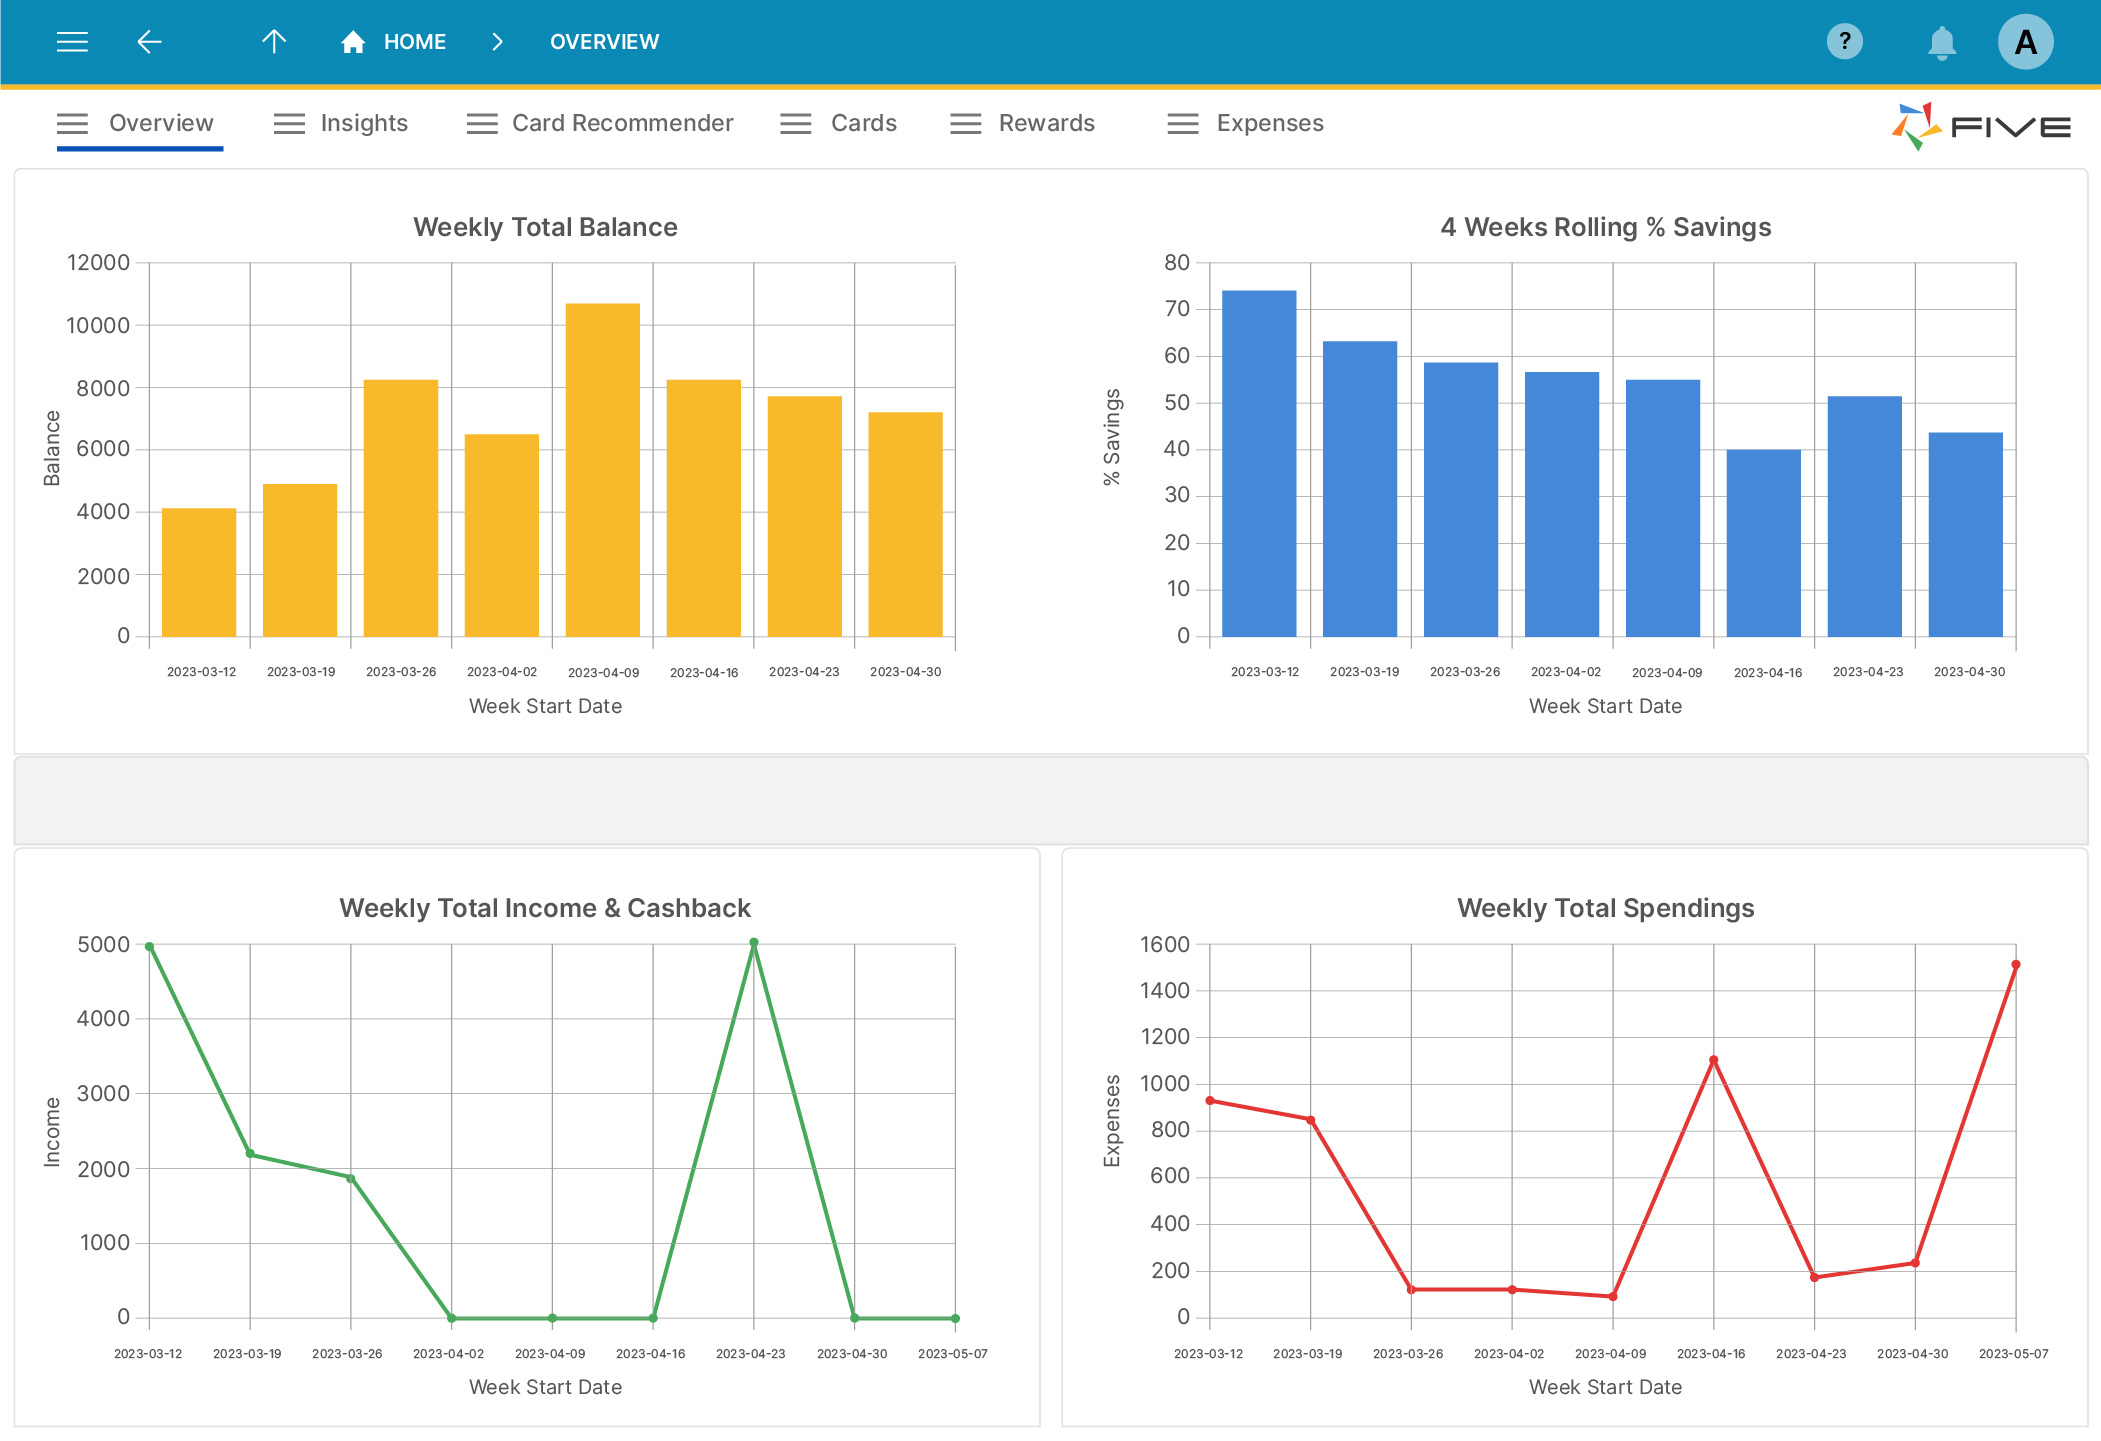
Transform raw data into actionable insights with Five’s low-code application builder. Uncover trends to drive data-informed decisions and create intuitive, web-hosted dashboards.
Key Features of Five’s Data Visualization Dashboards
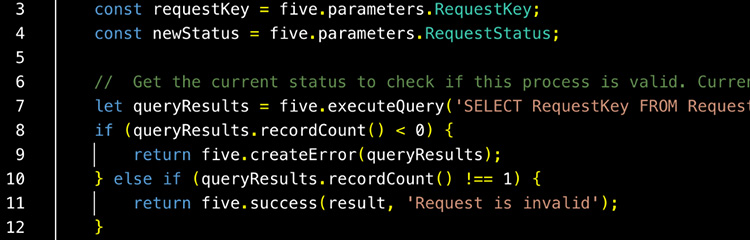
✅ Database & API Integration: Connect to almost any database or REST API endpoint to populate your dashboard with dynamic data.
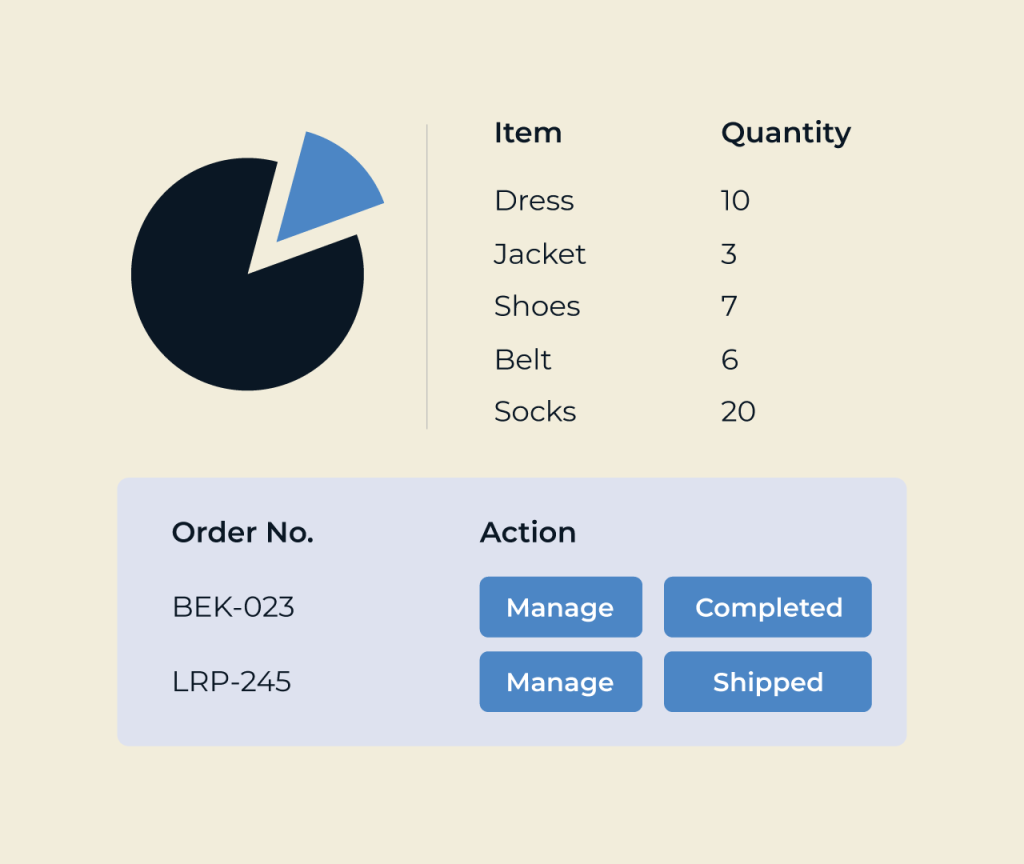
✅ Versatile Charting Options: Five’s built-in chart library comes with bar charts, pie charts, line charts, radar charts, and more.
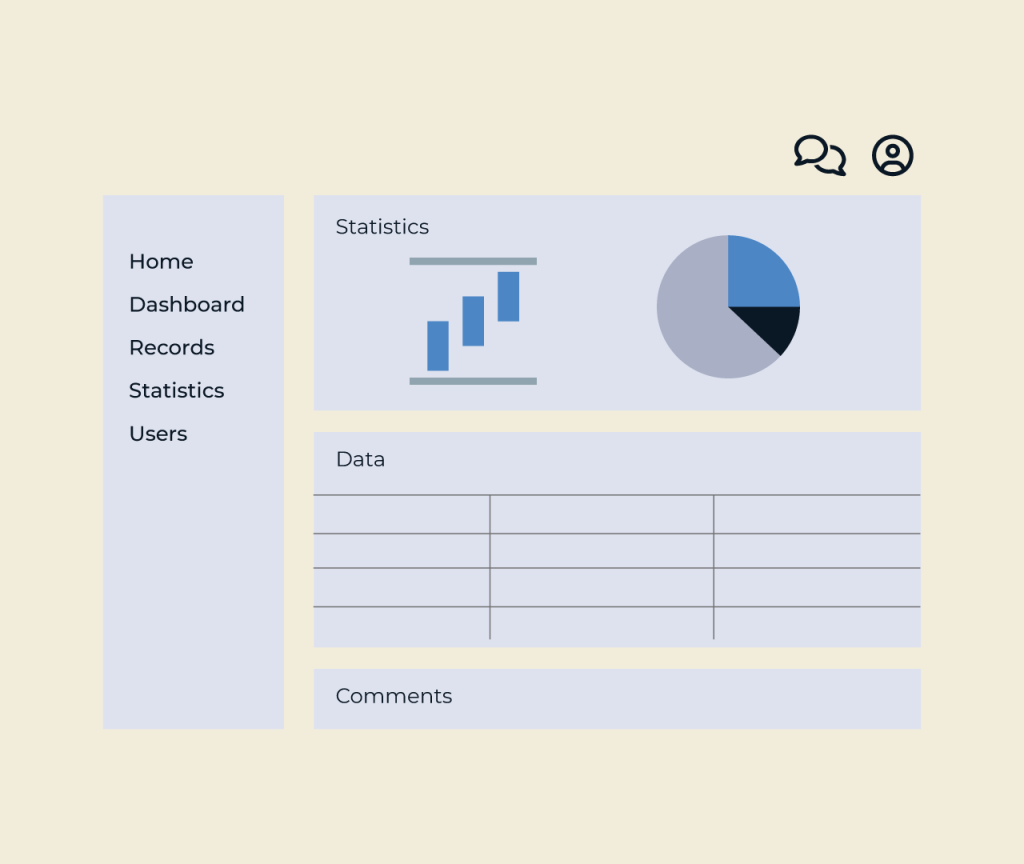
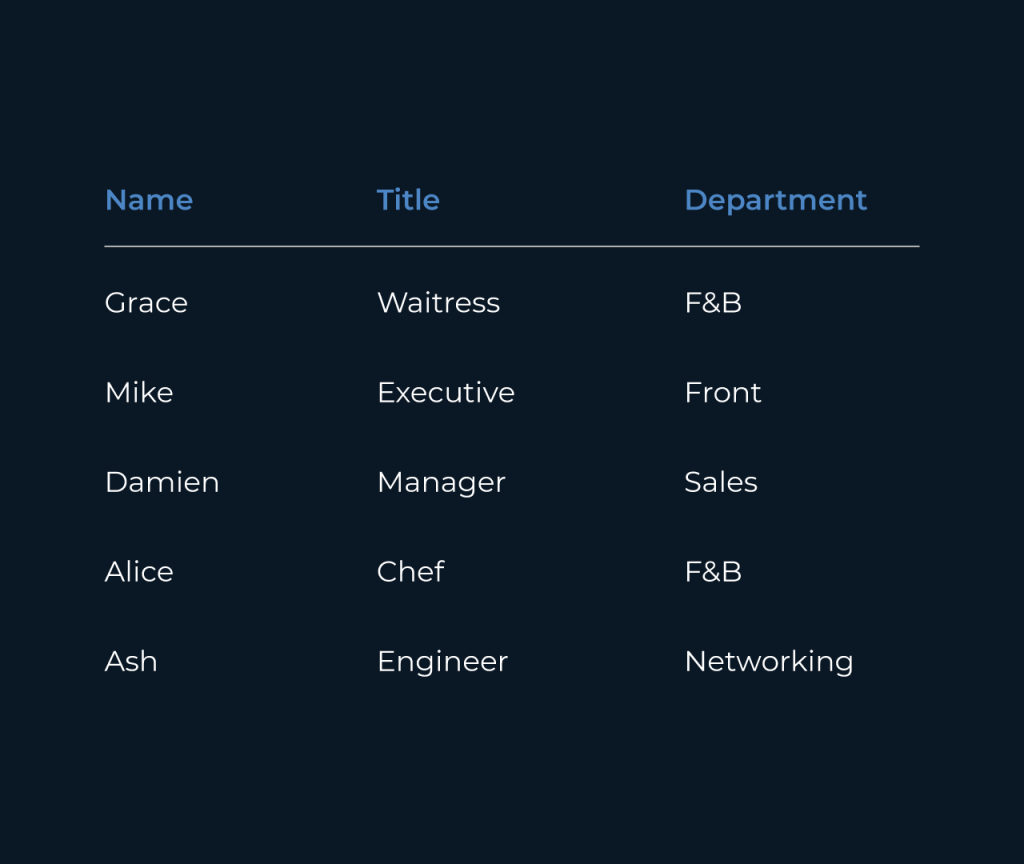
✅ Customizable Grid Layout: Arrange widgets, charts, and data visualizations using a flexible, grid-based interface to meet your unique needs.
✅ Multi-Dataset Support: Combine multiple datasets into a single visualization to uncover complex relationships and deeper insights.
✅ Interactive Drill-Downs: Enable users to explore data in detail by drilling down into specific metrics or trends.
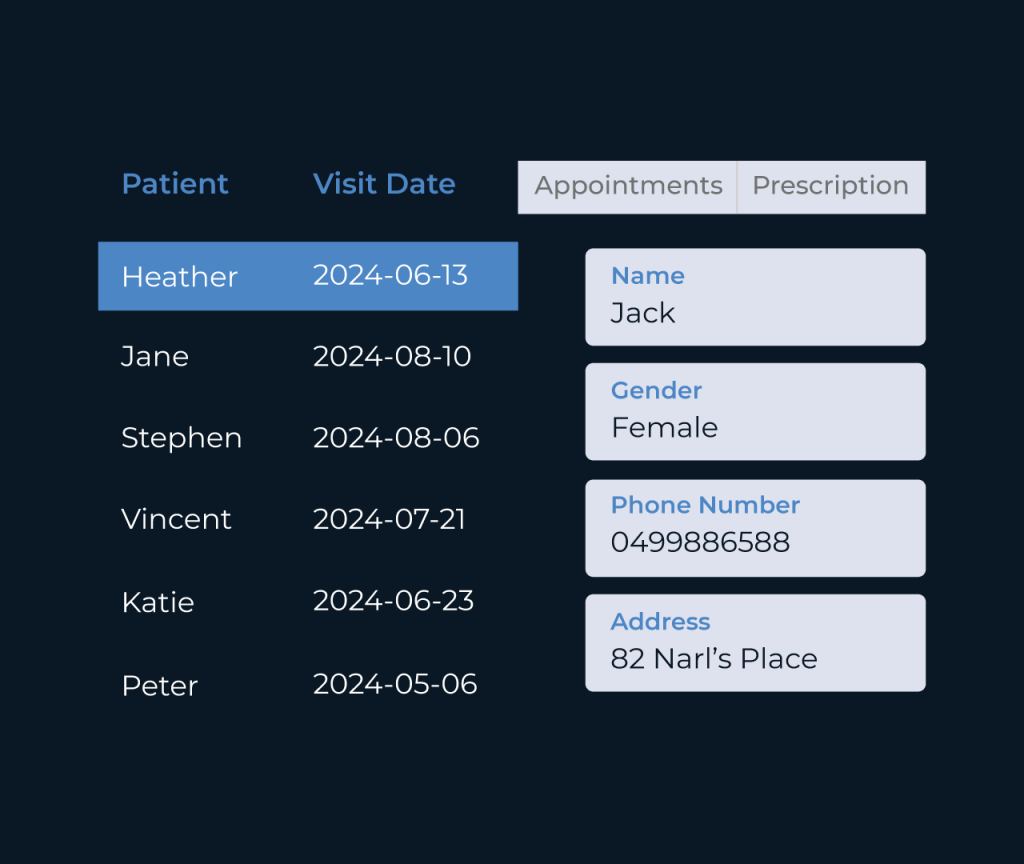
✅ Secure Access: Implement login-protected dashboards, ensuring that only authorized users can view or interact with sensitive data.
Go Beyond Traditional Data Visualization Tools
Why limit yourself to standalone tools like PowerBI, Tableau, or Google Looker Studio? With Five, you get a comprehensive platform for more than just visualization. Create entire web applications from scratch with integrated features for:
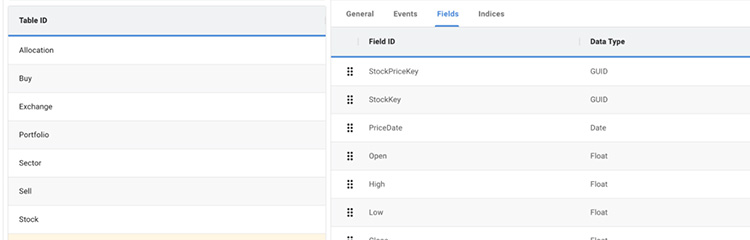
✅ Data Management: Design your own MySQL databases to collect, store, and analyze data.
✅ Custom Reporting: Add forms, generate PDF reports, and automate data collection workflows.
✅ Notifications & Interactivity: Send in-app notifications to keep users informed in real time.
Manage all your data needs in one platform: from data collection to data visualization with Five.