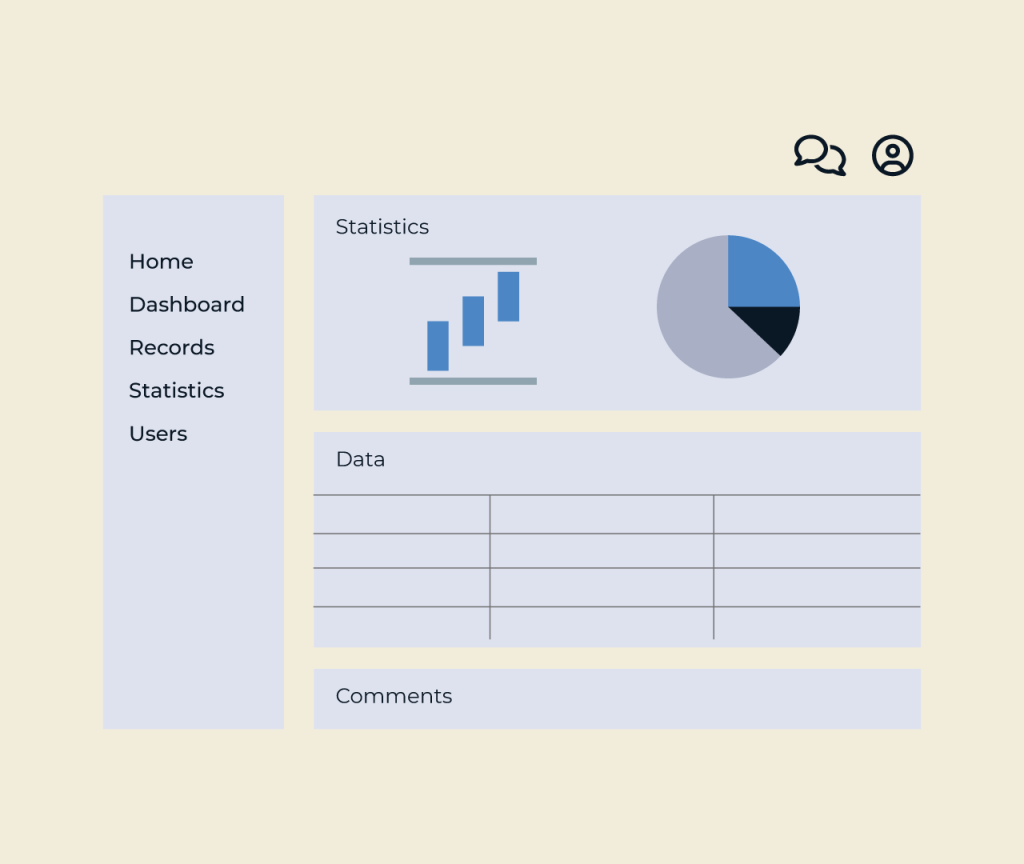
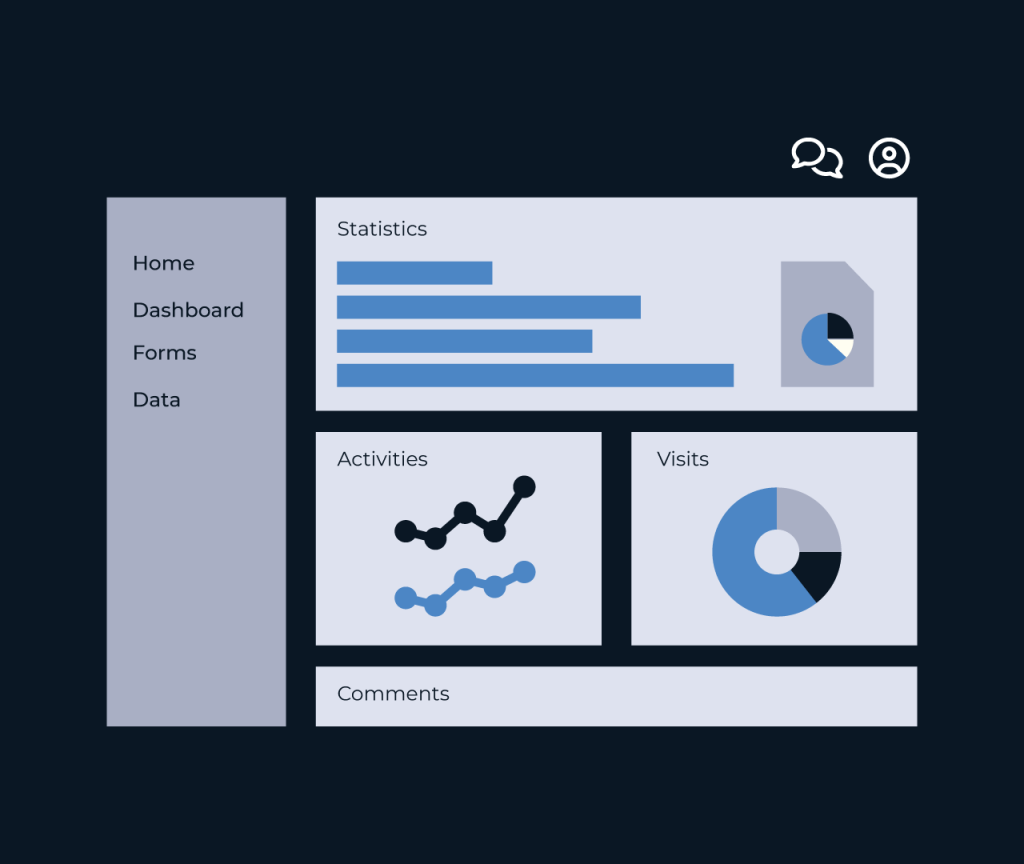
Creating an e-commerce analytics dashboard is essential for tracking performance metrics and making informed business decisions. A well-designed dashboard consolidates data from various sources, allowing businesses to monitor sales trends, customer behavior, and inventory levels in real time.
Five enables you to build a comprehensive e-commerce analytics dashboard effortlessly. With its user-friendly interface, you can integrate data from multiple platforms, customize visualizations, and set up automated reporting. This empowers you to gain actionable insights quickly, optimize your marketing strategies, and enhance overall operational efficiency.
You can build it yourself using Five, a development environment designed for rapid application creation. Equipped with intuitive tools, Five makes development faster, though there is a learning curve, and complex applications still take time to fully develop. If you need a simple solution, Five is a great choice. But for more advanced requirements, Option 2 might be a better fit.
Our experienced development team builds your application using Five. By using the Five platform, our team can convert requirements into working software 10x faster than traditional approaches to software engineering. When working with us, our clients see working software almost immediately.
An e-commerce analytics dashboard will be used by a variety of stakeholders in the online retail space. This includes business owners who want to track overall performance, marketing teams looking to analyze campaign effectiveness, and product managers focusing on sales trends. Additionally, customer service teams may utilize the dashboard to understand buyer behavior, while data analysts dig into the numbers for deeper insights. Even executives and investors may reference this data to make informed decisions about the company's strategy and growth opportunities.
Five is an excellent platform for creating an e-commerce analytics dashboard due to its ability to rapidly integrate and process data from various sources. You can easily build a fully managed MySQL database and connect it to external data sources, allowing you to pull in key metrics and insights from your e-commerce platform. With its intuitive SQL query capabilities, you can generate complex reports and visual analytics without extensive coding knowledge. Moreover, Five's auto-generated responsive user interface simplifies the front-end development process. You can customize the dashboard's appearance to align with your brand while focusing on the critical analytics that drive your business. The deployment process is seamless, enabling you to share insights with stakeholders quickly and effectively.
To create an effective e-commerce analytics dashboard, it's crucial to collect data on key metrics like sales revenue, conversion rates, and average order value. Tracking customer demographics and behavior can help identify trends and preferences, while monitoring cart abandonment rates provides insights into potential issues in the buying process. Additionally, understanding traffic sources is essential to gauge the effectiveness of marketing efforts. Collecting information on product performance, including returns and customer reviews, will also enhance decision-making. Overall, integrating these elements will lead to a more comprehensive view of the business and drive informed strategies.
An e-commerce analytics dashboard serves as a central hub for tracking and analyzing key performance metrics related to online sales. It aggregates data from various sources, allowing businesses to see insights about customer behavior, sales trends, and product performance in real-time. With this information, companies can make informed decisions to enhance their marketing strategies, optimize their inventory, and improve the overall customer experience. By monitoring these metrics consistently, businesses can identify areas for growth and adjust their strategies accordingly to drive revenue and increase customer satisfaction.
Building an E-Commerce Analytics Dashboard is straightforward with Five. Follow these three essential steps:
1. In the Five development environment, click on Applications and then the yellow Plus icon to start a new application.
2. Name your application, such as E-Commerce Dashboard, and save your changes.
1. Access the Table Wizard under the Data section to create essential tables.
2. Define tables such as Products, Sales, and Analytics to store relevant e-commerce data.
3. Set relationships between tables to enable complex queries that analyze sales performance, customer behavior, and inventory levels.
1. Utilize the Chart Wizard to create visual representations of your data, such as line charts for sales trends and bar charts for product performance.
2. Create reports using the Reports feature to generate PDF summaries of your analytics, making it easy to share insights.
3. Add these visual components to your application menus for easy access by users, enabling them to explore the data effectively.
With these three steps, you can build a robust E-Commerce Analytics Dashboard that helps track and improve your online store’s performance.
From project management tools, progress tracking apps, customer portals, and performance dashboards to functional CRUD apps, Five helps you build and deploy faster.