Calculating... until our next FREE Code-Along Session. Secure your spot now

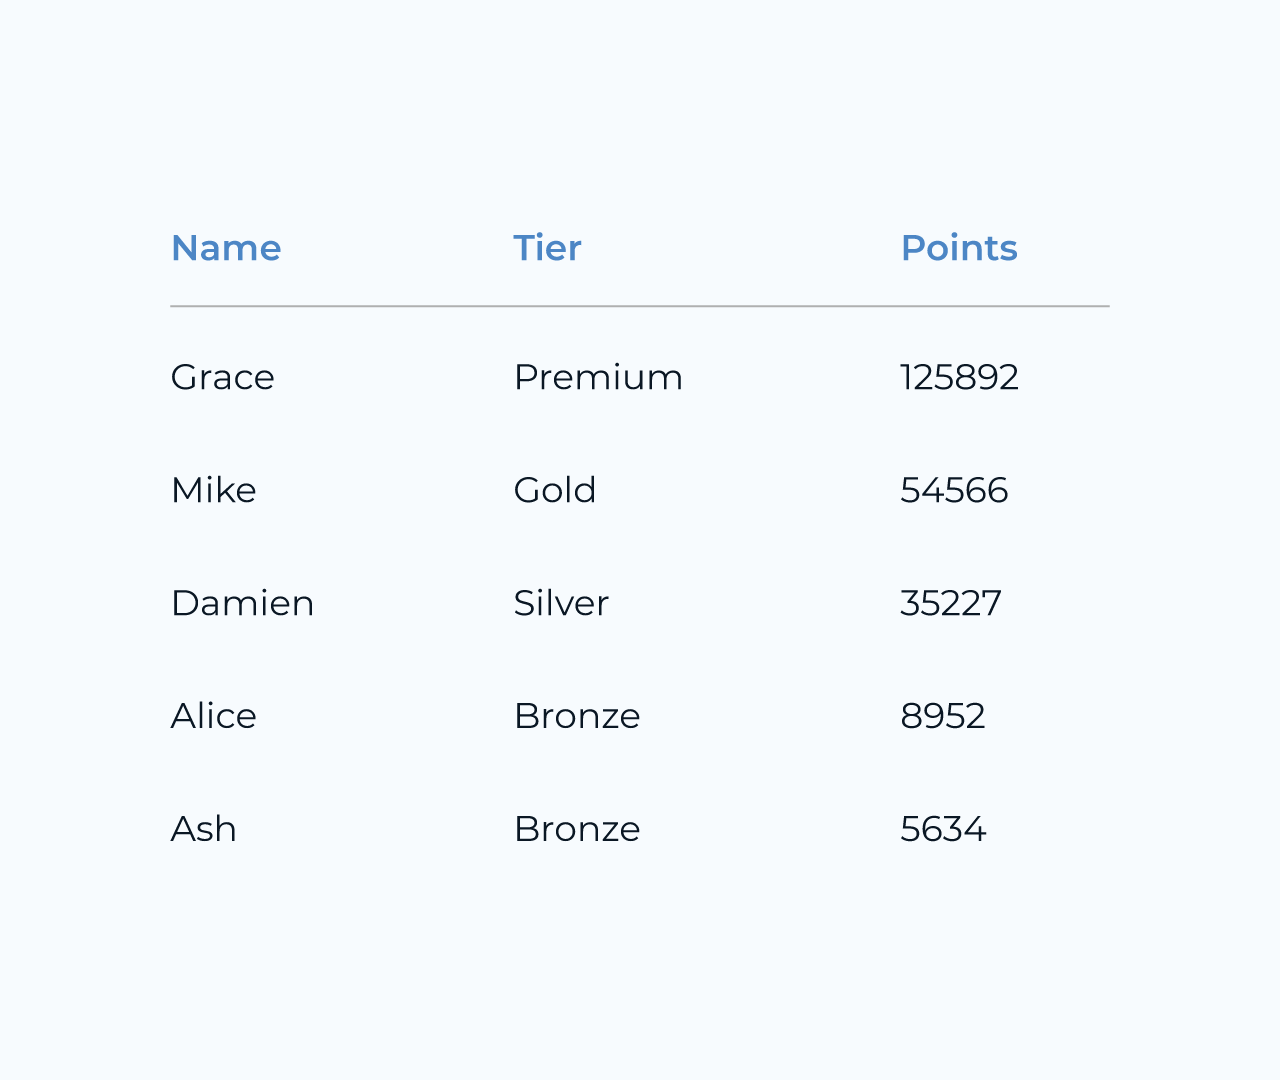
Create a Regional Sales Performance Dashboard

Creating a regional sales performance dashboard is essential for tracking key metrics and optimizing strategies. With Five, you can easily consolidate data from various sources, enabling real-time visualization of sales performance across different regions. This intuitive platform allows users to customize dashboards, highlight trends, and monitor KPIs that matter most to their business goals.

Five offers powerful analytics tools that empower teams to make data-driven decisions. Users can drill down into specific regions, compare performance metrics, and identify growth opportunities. By leveraging these insights, businesses can enhance their sales strategies and boost overall productivity across their regional teams.

Don’t want to go through the hassle of building it yourself? Our team of developers will develop a prototype solution in 2 to 4 weeks – at a fraction of the cost of other providers and completely tailored to you.

Get Started Built For You?

Build Yourself vs Built For You

Build it Yourself Using Five

You can build it yourself using Five, a development environment designed for rapid application creation. Equipped with intuitive tools, Five makes development faster, though there is a learning curve, and complex applications still take time to fully develop. If you need a simple solution, Five is a great choice. But for more advanced requirements, Option 2 might be a better fit.

We Build It For You

Our experienced development team builds your application using Five. By using the Five platform, our team can convert requirements into working software 10x faster than traditional approaches to software engineering. When working with us, our clients see working software almost immediately.

Regional Sales Performance Dashboard FAQ's

A regional sales performance dashboard serves as a vital tool for tracking and analyzing sales metrics across different areas. It provides a clear overview of performance trends, helping teams identify strengths and weaknesses in their strategies. This insight enables sales managers to make informed decisions and adjust tactics based on real-time data. Moreover, the dashboard fosters accountability within the sales team by highlighting individual and team contributions to overall goals. By comparing performance against targets, it encourages motivation and healthy competition. Ultimately, this tool enhances operational efficiency and drives sales growth within specific regions.

A regional sales performance dashboard will be used by sales managers and team leaders who need to track their team's progress and identify areas for improvement. These professionals rely on real-time data to make informed decisions and set achievable targets for their team members. Additionally, executives and senior management may use the dashboard to analyze regional trends and performance metrics. This helps them make strategic decisions that can impact overall business growth and resource allocation. By having access to this dashboard, they can stay informed and align their strategies with the performances of various regions.

Five is an excellent choice for creating a Regional Sales Performance Dashboard because it allows you to easily build applications that can connect to multiple data sources, including external databases and APIs. With its built-in MySQL database and visual database builder, you can quickly set up tables and relationships tailored for your sales data, eliminating the inefficiencies of spreadsheets. Additionally, Five's intuitive interface enables rapid deployment and customization, so you can create responsive dashboards that display real-time sales metrics across different regions. You can generate reports and charts using SQL queries or the drag-and-drop query builder, making it effortless to showcase performance data effectively.

To build an effective regional sales performance dashboard, it is crucial to collect data such as total sales figures, the number of units sold, and revenue by region. Tracking sales trends over time and comparing them with targets can provide insights into performance levels. Additionally, incorporating metrics like customer acquisition costs, average transaction value, and sales by product category can enhance understanding. Gathering information on customer demographics and feedback can also be beneficial. These elements together create a comprehensive view of regional sales performance, guiding strategic decisions for improvement.

Why Five Is Great For Regional Sales Performance Dashboards

Integration and Scalability

Five makes it easy to create a Regional Sales Performance Dashboard by allowing seamless integrations with CRM, ERP, and other business systems. You can connect external databases and APIs to pull in sales data, enabling real-time insights and analytics. With built-in tools for visualizing performance metrics, you can create dynamic charts and reports. This integration capability ensures that your dashboard not only reflects up-to-date sales data but also scales as your business needs evolve, delivering a comprehensive view of your regional sales efforts.

Flexibility and Customization

With Five, creating a regional sales performance dashboard is a breeze. The platform offers flexible, low-code development, allowing you to customize your dashboard easily to fit your specific needs. Tailor data visualizations, forms, and access controls without extensive coding knowledge. Seamlessly integrate external services for real-time updates, and deploy your dashboard in just a few clicks. Five’s user-friendly interface empowers you to build a powerful, personalized tool that evolves with your business requirements.

Build With Speed

Five accelerates the creation of a regional sales performance dashboard by streamlining database management and application development. Unlike traditional approaches that require extensive coding and manual integration, Five's intuitive, visual interface allows users to quickly design databases, generate user-friendly dashboards, and deploy applications with minimal effort. Its built-in tools for role-based access, automation, and real-time notifications further enhance efficiency. In contrast to legacy methods, Five empowers users to rapidly develop and adapt their applications, significantly reducing time to market.

Five Co Use Cases

Creating a Regional Sales Performance Dashboard in Five

Follow these three easy steps to build your dashboard:

Step 1: Set Up Your Application

1. Create a new application in Five and name it Regional Sales Performance Dashboard.

2. Enable multiuser functionality to manage different user roles.

3. Deploy your application to preview the user interface.

Step 2: Build Your Database

1. Use the Table Wizard to create key tables such as:

  • SalesData
  • Regions
  • SalesRepresentatives

2. Establish relationships between these tables to enable data connectivity.

3. Validate that your database structure meets the application requirements.

Step 3: Create Visual Outputs

1. Utilize the Visual > Chart Wizard to create visual representations of your sales data.

2. Generate a SQL query to pull relevant data for analysis.

3. Add charts and reports to your application, ensuring they are accessible from the menu.

By following these steps, you will build a functional and dynamic Regional Sales Performance Dashboard using Five!


Centered Text


What More Can You Do With Five?

From project management tools, progress tracking apps, customer portals, and performance dashboards to functional CRUD apps, Five helps you build and deploy faster.


Start developing your first application!

Get Started For Free Today

Sign Up Free Book a demo

Build Your Web App With Five

200+ Free Trials Started This Week

Start Free

Thank you for your message!

Our friendly staff will contact you shortly.

CLOSE