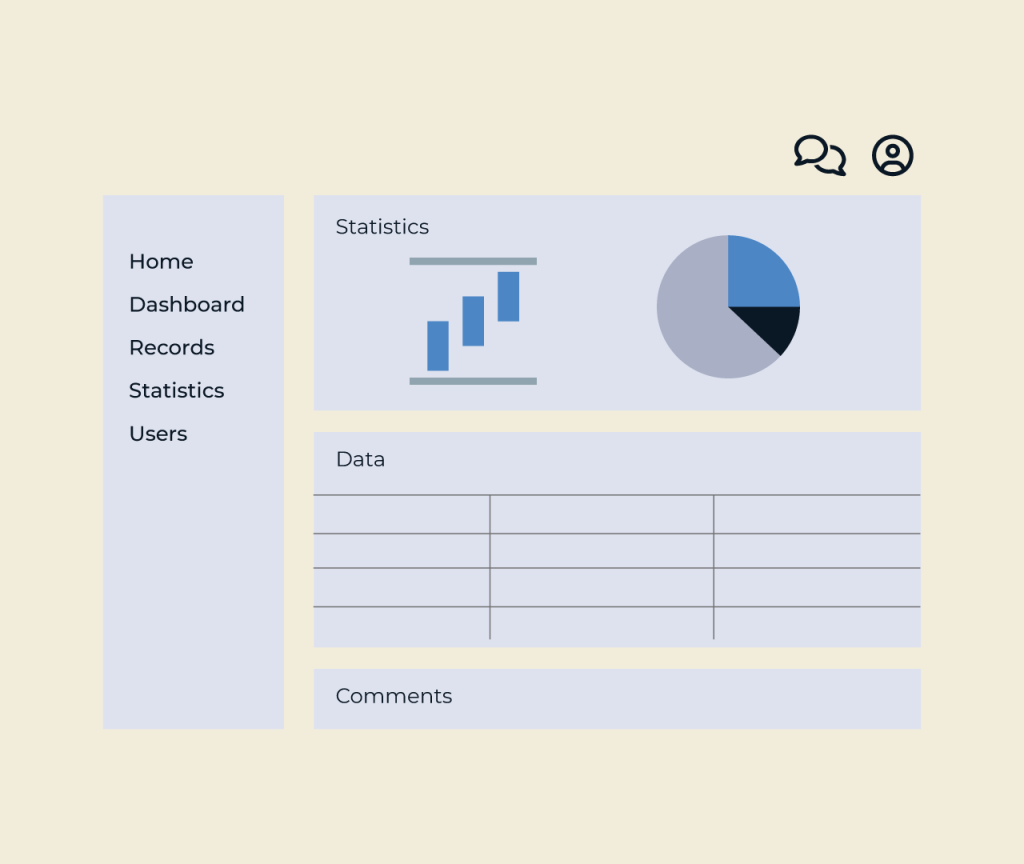
Creating a resource allocation dashboard is essential for effective project management, allowing teams to visualize resource distribution and utilization at a glance. With Five, you can seamlessly build a customizable dashboard that displays all necessary metrics, from workload balance to task assignments, enhancing decision-making processes.
Five’s intuitive interface empowers users to drag and drop widgets, choose relevant KPIs, and apply filters to focus on specific projects or teams. By integrating real-time data, the dashboard not only improves transparency but also aids in identifying potential bottlenecks, ensuring resources are optimized for maximum productivity.
You can build it yourself using Five, a development environment designed for rapid application creation. Equipped with intuitive tools, Five makes development faster, though there is a learning curve, and complex applications still take time to fully develop. If you need a simple solution, Five is a great choice. But for more advanced requirements, Option 2 might be a better fit.
Our experienced development team builds your application using Five. By using the Five platform, our team can convert requirements into working software 10x faster than traditional approaches to software engineering. When working with us, our clients see working software almost immediately.
When creating a resource allocation dashboard, it is crucial to gather data on resource utilization, including personnel, budget, and equipment availability. Tracking how much of each resource is currently in use versus what is allocated helps in making informed decisions. Additionally, collecting information on project timelines, priorities, and outcomes can provide insights into how resources are affecting overall performance. It is also important to monitor any changes in demand for resources as projects evolve. This comprehensive view ensures that resources are allocated efficiently and addresses any potential issues proactively.
A resource allocation dashboard helps organizations visualize and manage their resources effectively. It provides a clear overview of how resources such as time, money, and personnel are distributed across various projects or tasks. By offering real-time data and insights, the dashboard enables decision-makers to identify gaps, prioritize needs, and optimize resource utilization. This leads to improved efficiency and better overall project outcomes, ensuring that teams have what they need to succeed without unnecessary waste.
A resource allocation dashboard will be used by project managers who need to oversee the distribution of resources across various tasks. It will also appeal to team leaders looking to optimize their teams' efficiency and ensure that workloads are balanced. Additionally, executives and stakeholders will benefit from this dashboard as it provides a clear overview of resource utilization, helping them make informed decisions. Analysts can leverage the data to identify trends and forecast future resource needs, making it a valuable tool for anyone involved in managing resources efficiently.
Five is an excellent choice for creating a resource allocation dashboard because it allows developers to rapidly build applications using a visual database builder. You can easily connect to various data sources and utilize SQL queries to retrieve and process relevant data. This flexibility makes it simple to generate charts, reports, and dashboards tailored to your resource allocation needs. With Five, there is no necessity for extensive front-end development skills, as it automatically generates a responsive user interface. Additionally, you can set up business logic and workflows to automate tasks, making the management of resources efficient and streamlined.
Welcome to the quick guide on building a Resource Allocation Dashboard using Five!
Start by creating a new application in Five. Click on Applications and then the yellow Plus icon. Title your application ‘Resource Allocation Dashboard’ and save.
Use the Table Wizard to create necessary database tables for resources and allocations. You might create tables such as Resources, Allocations, and Users. Make sure to define relationships, especially if you have a many-to-many relationship for resources and allocations.
Utilize the Form Wizard to create user-friendly forms for inputting resource data. Incorporate Visual > Chart Wizard for graphical representation of resource allocation and create a menu to navigate between forms, charts, and reports. Ensure your dashboard is responsive and accessible.
Congratulations! You now have a solid foundation for your Resource Allocation Dashboard using Five.
From project management tools, progress tracking apps, customer portals, and performance dashboards to functional CRUD apps, Five helps you build and deploy faster.