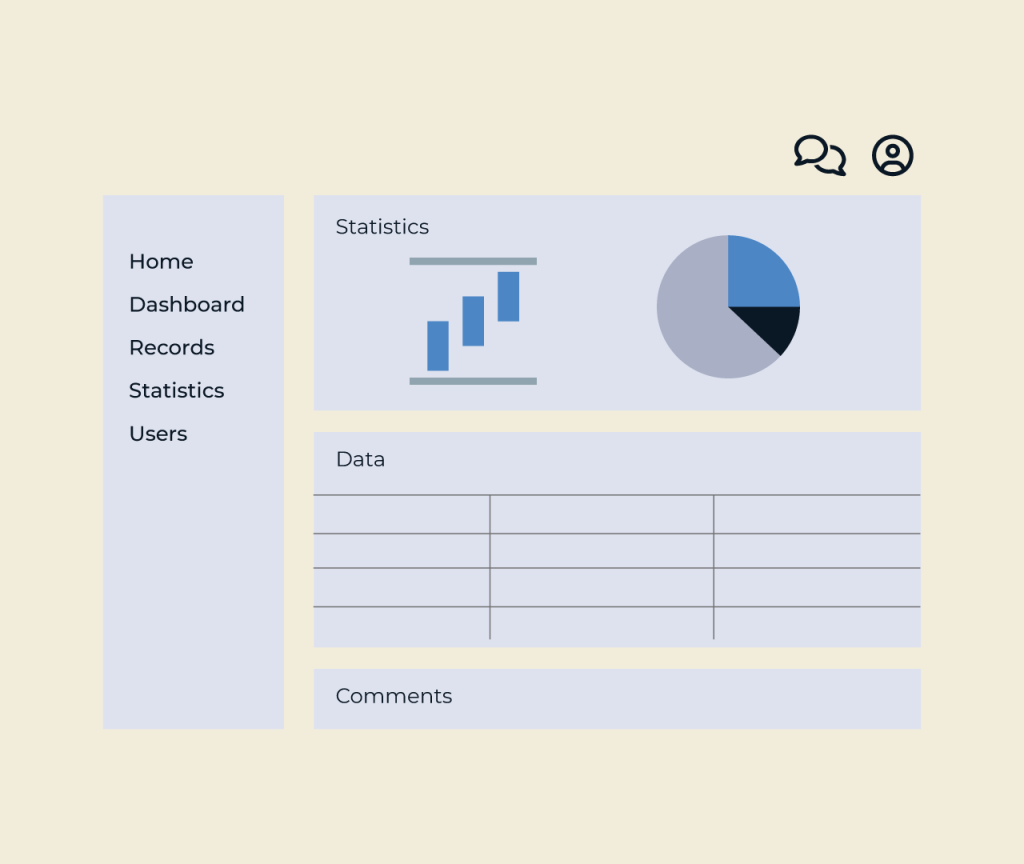
Creating a sales performance dashboard is essential for tracking your team’s effectiveness and aligning strategies with business goals. A well-designed dashboard provides valuable insights into key performance indicators (KPIs), helping you make data-driven decisions that can drive growth and efficiency.
Five simplifies the process of building a customized sales performance dashboard. With its intuitive interface, users can easily select and visualize relevant metrics such as sales growth, conversion rates, and customer acquisition costs. Effortlessly integrate data from various sources to gain a comprehensive view of your sales landscape, enabling you to optimize performance and fuel success.
You can build it yourself using Five, a development environment designed for rapid application creation. Equipped with intuitive tools, Five makes development faster, though there is a learning curve, and complex applications still take time to fully develop. If you need a simple solution, Five is a great choice. But for more advanced requirements, Option 2 might be a better fit.
Our experienced development team builds your application using Five. By using the Five platform, our team can convert requirements into working software 10x faster than traditional approaches to software engineering. When working with us, our clients see working software almost immediately.
Sales performance dashboards will be used by sales managers and team leaders to track their teams' progress and identify areas for improvement. They help in setting clear goals and measuring performance against targets. Additionally, sales representatives themselves will find these dashboards beneficial for monitoring their individual performance and managing their own sales pipelines. By having real-time data, they can better understand their strengths and weaknesses, allowing them to make informed decisions that enhance their overall effectiveness.
Five is an excellent platform for creating a Sales Performance Dashboard due to its ability to seamlessly integrate and query multiple data sources. With its built-in MySQL database and support for external databases, you can easily consolidate sales data and run complex SQL queries to generate insights efficiently. Additionally, Five automates the front-end development process, allowing you to build responsive dashboards without needing extensive design skills. Its customizable UI ensures that the dashboard is tailored to your specific business needs, while rapid deployment capabilities make it easy to share insights with your team.
To create an effective sales performance dashboard, you should focus on key metrics like total sales, sales growth percentage, and profit margins. Understanding these figures provides insight into overall performance and helps identify trends. Additionally, tracking conversion rates and lead sources can guide improvements in the sales process. It is also important to include data on individual sales team member performance and customer demographics. This information allows for personalized coaching and targeted strategies. Finally, integrating real-time data and visualizations will make the dashboard more useful, enabling quick decision-making and adjustments as needed.
A sales performance dashboard serves to provide a visual representation of sales data, making it easier for teams to track progress and identify trends. By having key metrics displayed in one place, sales professionals can quickly assess their performance and make informed decisions. This dashboard can help pinpoint strengths and weaknesses within the sales process, guiding strategies for improvement. It encourages accountability and transparency among team members, fostering a culture of performance optimization and goal achievement. Ultimately, it streamlines the sales process and supports better results.
Creating a Sales Performance Dashboard in Five is a straightforward process. Follow this three-step guide to get started!
1. Create a new application by clicking on the Applications section and using the Plus icon.
2. Name your application Sales Performance Dashboard.
3. Deploy and run your application to see the initial layout.
1. Use the Data > Table Wizard to create essential tables like Sales, Products, and Customers.
2. Define fields relevant to sales data, such as SalesAmount, SaleDate, ProductID, and CustomerID.
3. Set up relationships (e.g., many-to-many between Products and Sales) using the Database Modeler.
1. Create user-friendly forms using the Visual > Form Wizard for data input and updating.
2. Use the Visual > Chart Wizard to build visual representations of sales data, like bar charts showing monthly sales trends.
3. Lastly, integrate a report system to generate PDF summaries of sales performance using the Visual > Reports feature.
By following these steps, you will have a functional Sales Performance Dashboard ready for users!
From project management tools, progress tracking apps, customer portals, and performance dashboards to functional CRUD apps, Five helps you build and deploy faster.