Create an SQL Dashboard In 4 Steps
How to Create an SQL Dashboard
The ability to make informed decisions is so important for businesses. However, raw data alone is not enough; it needs to be turned into meaningful insights. This is where an SQL dashboard is useful.
An SQL dashboard is a tool that allows you to visualize and interact with your database information in real-time.
By creating a custom SQL dashboard, you can turn complex queries into easy-to-understand charts, graphs, and tables, making data accessible to both technical and non-technical team members alike.
We’ll guide you through the process of creating an SQL dashboard the easy way.
Why Do You Need an SQL Dashboard?
SQL dashboards provide instant visual representations of your data. Instead of sifting through rows and columns of raw SQL data, you have graphs, charts, and other visual elements that make trends and patterns immediately apparent.
This allows non technical staff to understand complex data without needing SQL expertise. This information should hopefully be presented in a user-friendly format, with different views for different user roles, ensuring everyone has the information they need.
With an SQL Dashboard you can easily compare current performance against historical data and identify trends that might not be clear day to day.
From business executives and managers who need high-level overviews of company performance, to data analysts diving deep into trends, and from sales and marketing teams tracking campaign effectiveness to operations managers monitoring production efficiency, SQL dashboards can provide valuable insights across all sectors.
Choosing the Right Tools For Your SQL Dashboard
When creating an SQL dashboard, choosing the right tools is key. You need the right database platform and dashboard tool, or a platform like Five that combines both in one.
The foundation of any SQL dashboard is the database platform itself. Your choice depends on your existing infrastructure, data volume, and specific requirements. MySQL, an open-source option, is excellent for web-based applications and performs well with read-heavy workloads. PostgreSQL, another open-source contender and supports complex queries and data types.
Once you have your data source in place, you’ll need tools to visualize that data effectively. The market offers a range of options, from code-based solutions to user-friendly drag-and-drop interfaces. For those comfortable with coding, libraries like D3.js, Plotly, and R Shiny allow for highly customized visualizations.
The other option is to choose Five. Five is an online database builder designed to make creating an SQL dashboard much faster. It makes SQL simple. Every app developed in Five comes with its own, integrated MySQL database.
Creating a SQL dashboard with Five won’t be entirely effortless (though we have plenty of free templates available), but it will be significantly easier than spending 60+ hours learning various coding frameworks and languages.
With Five, you can
- Set up a MySQL database or connect your database in minutes, and
- Create a login-protected, user-friendly interface that works well on the web and on any device, such as desktop, tablet, or mobile.
- You can also import your existing data straight into your MySQL database.
- Visualise/dashboard your data in minutes.
Perhaps the most exciting feature of Five for dashboard creation is its data visualization capabilities. With Five, you can create custom charts and dashboards to bring your SQL data to life. Five allows you to create various types of charts, including line graphs, bar charts, pie charts, and more. These can be customized to match your branding and design preferences.
Your charts and dashboards can be set up to update in real-time as your database changes, ensuring you’ll always be analysing the latest data.
Get free access to Five here and start building your SQL dashboard.
Getting Started with Five
If Five sounds interesting here’s a quick start guide to creating an SQL dashboard.
To begin creating your SQL dashboard with Five, get free access to the platform and start building!
Don’t Feel Like Reading?
Watch the YouTube video and learn how to build dashboards.
Note we will be using the query and data view from the How To Execute A Query In SQL session and the chart from the How To Build Charts Using The Chart Wizard.
Step 1: Select Layout
Start by opening Five and loading your application that includes your saved query and chart. To begin building a dashboard, click on ‘Visual‘, then select ‘Dashboards‘ and give your application an appropriate name (for this blog we will refer to it as Product Dashboard).
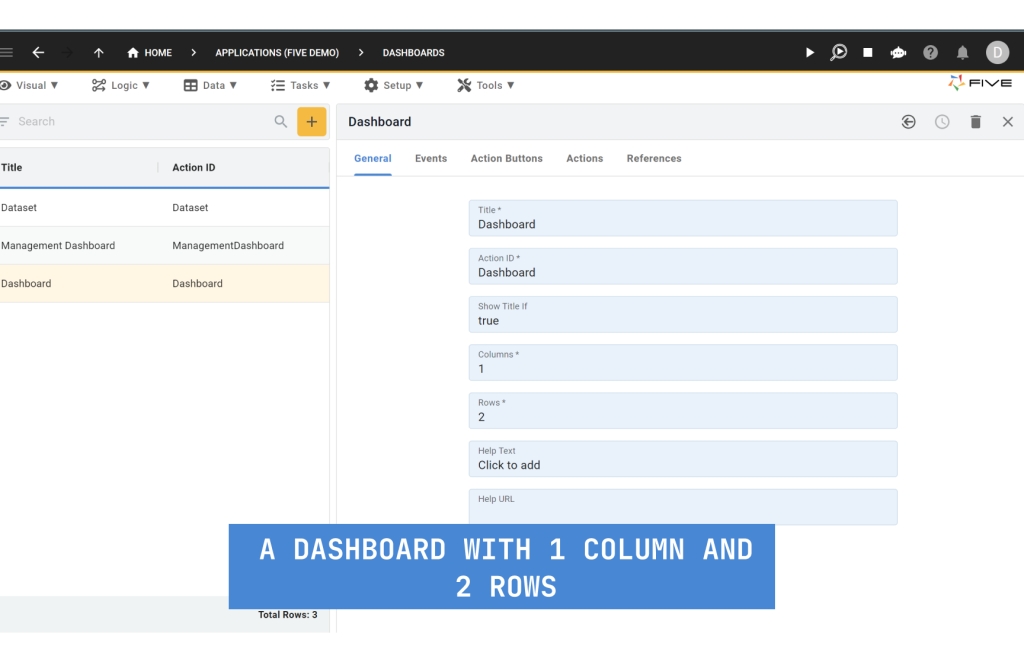
Next, you need to specify the layout of your dashboard, which works like a grid. You can choose how many rows and columns you want to have in your dashboard, depending on how many items you want to display. For example, if you want to show four items, you can have 2 columns and 2 rows, and the layout will look something like this:

For this session, we will be adding a query and a chart so we will give it a grid of 1 Column and 2 Rows
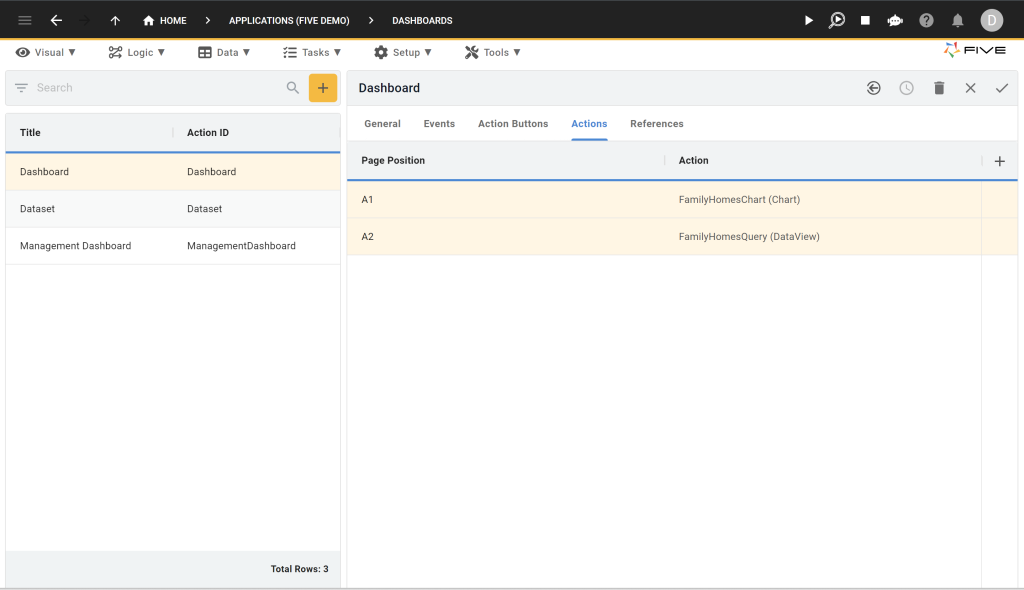
Next, click on the ‘Actions’ tab to begin adding items to our dashboard. Click on the ‘+’ icon, select the desired position in the page position field, followed by selecting the data view that we constructed in the How To Execute A Query In SQL session and next do the same but for charts. After you are done you should have a dashboard with action items like the one shown below:
Step 2: Adding the Dashboard
Now that our Dashboard is ready to use let’s add a menu item in your end-user application through which we can view it.
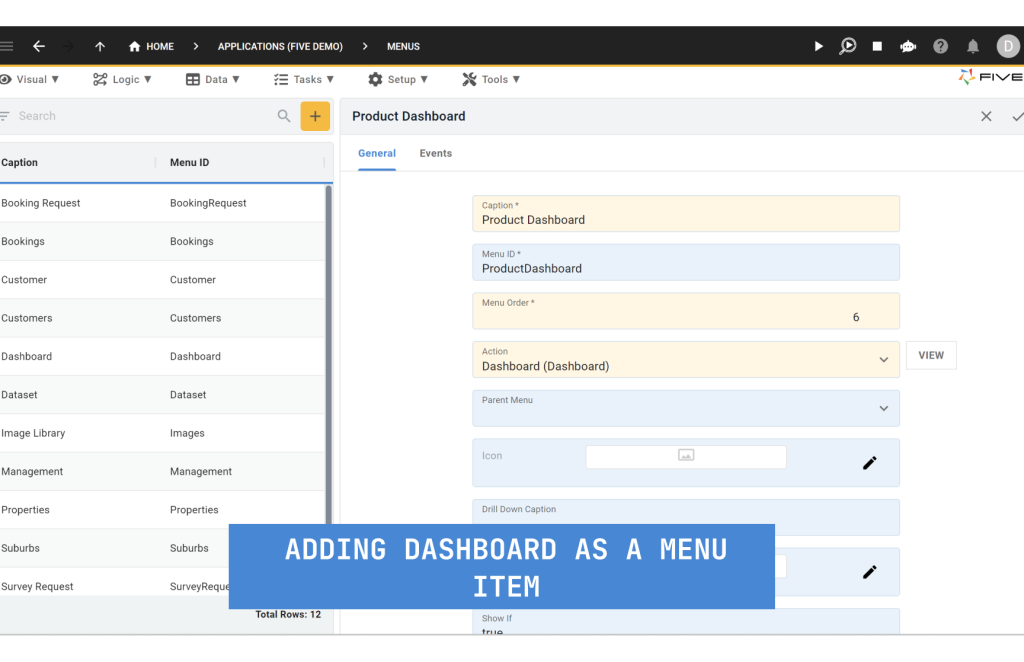
Head over to the ‘Visual’ section again and select ‘Menu’. Here, we’ll create a new menu item. In the ‘Action’ field, select the dashboard that we just made and give it an appropriate name.
Step 3: Run Your Application
Now let’s finally run our application by clicking the play ▶️ button located in the top right corner, as shown below.

As the application launches, click on the menu item that we just made, and you should have a dashboard on your screen.
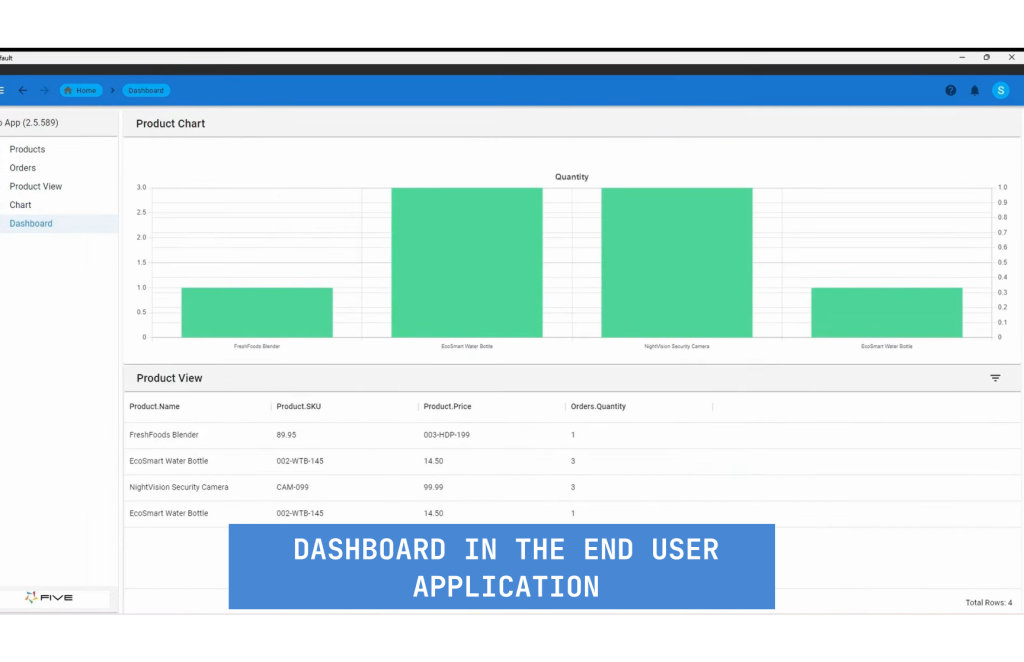
Congratulations, you have successfully added a dashboard to your application!
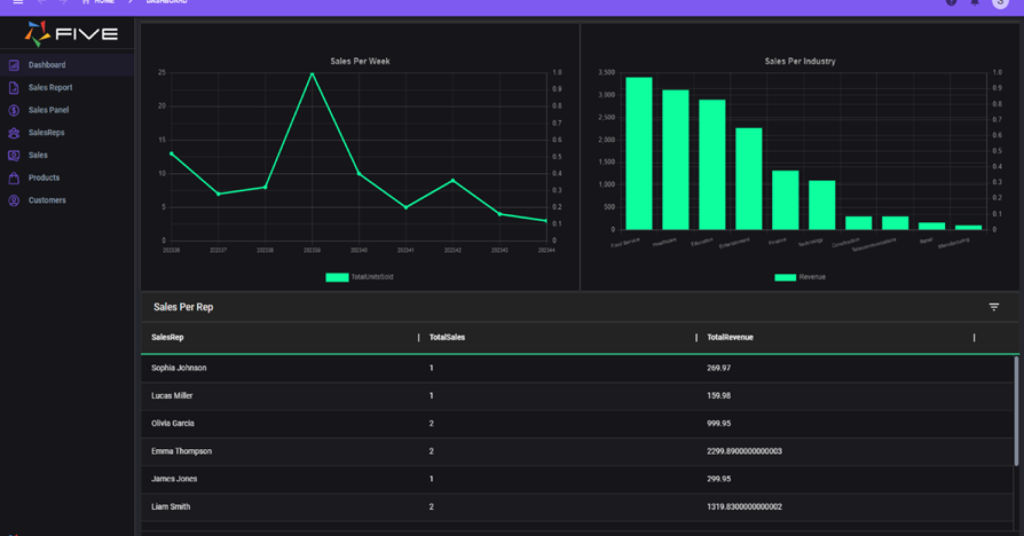
Here’s an example of a dashboard created in Five:
Summary: Create an SQL Dashboard
Creating an SQL dashboard is a great way to turn raw data into insights, allowing businesses to make decisions quickly and efficiently.
While raw data can be overwhelming, a well-designed SQL dashboard simplifies complex queries into clear, easy-to-understand visualizations, making it accessible to both technical and non-technical team members.
Choosing the right tools is essential in building an effective SQL dashboard. Platforms like Five offer an all-in-one solution, combining the power of a MySQL database with intuitive data visualization capabilities. This simplifies the process, enabling you to create custom dashboards without needing extensive coding knowledge.

