Five Hackathon 2023: Meet the Winners and The BudgetHub Web App
Five Hackathon 2023: Meet the Winners and The BudgetHub Web App
Congratulations to Rui Qin Ng and Jia Hwee Wong from Singapore for winning Five’s 2023 Low-Code Hackathon!

Rui Qin is a Technical Solutions Architect at Mastercard with a Bachelor of Science in Information Systems and Operations Analytics from the
Together they created BudgetHub, a budgeting application that allows users to conveniently associate transactions with all of their bank accounts and cards so that they can manage their finances better and budget for their future.
Here’s what the judges liked about the application:
- The application solves a real-world problem: who doesn’t struggle with various credit cards, e-wallets, and bank accounts? BudgetHub makes it easy to get a comprehensive, all-in-one view onto your finances.
- Use of Five’s features: the application makes excellent use of Five’s pre-built features, such as forms, charts, and dashboards. By having the application’s navigation menu running along the top, Rui Qin and Jia Hwee made sure there’s more space for data visualizations – exactly what their end-users would demand.
- The application is very well documented: Rui Qin and Jia Hwee excelled in writing an excellent Medium article that covers everything about their application: functionality, developer notes, SQL queries, and JavaScript functions. And they made great use of screenshots to illustrate what their application looks like.
Below is a copy of their winning Medium post about their application.
Budgeting Made Simple: Save, Simplify, Succeed!
Introduction
Money in, money out. We have different bank accounts and financial products (such as debit/credit cards) across many banks. Without a consolidated view of all of our transactions, we are unable to gain a holistic view of our spending, much less being able to budget for the future. This can lead to financial stress, which is felt by about 70% of Americans in a recent survey conducted by CNBC.
Amidst the rising inflation, many people are leaning into credit card rewards to offset rising costs. However, we recognise the inconvenience of having to remember all the criteria necessary to earn credit card rewards.
Budgeting applications bring convenience, ease of use, financial awareness and a comprehensive view of one’s personal finances to users. Therefore, we developed BudgetHub, a budgeting application that allows the user to conveniently associate transactions with all of their bank accounts and cards so that they can manage their finances better and budget for their future.
Bank Accounts and Cards
Under the Bank Accounts and Cards menu, users can enter their bank account and card details respectively. This allows BudgetHub to differentiate between the various financial products in order to segment transactions to calculate account balances and accounts payable.

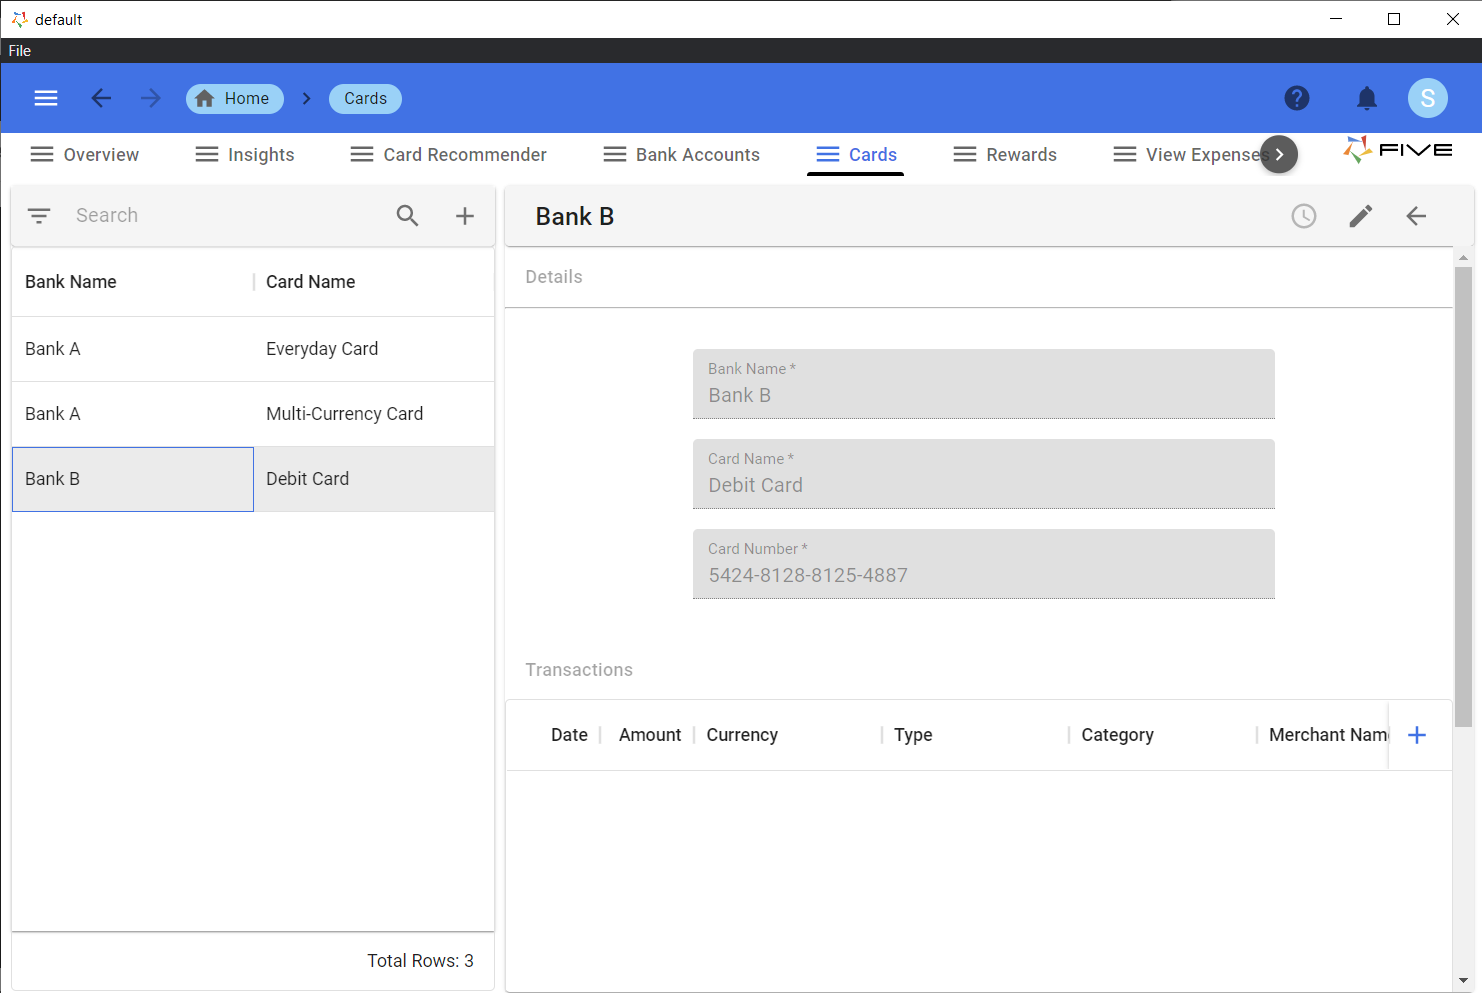
Bank Account and Card Forms
Transactions
Transactions can be entered into BudgetHub in the Bank Accounts and Cards menu. The transactions will automatically be associated. In addition to the amount, the following fields are available:
- Type: Income or Expense
- Currency (3 letter code; BudgetHub supports multi-currency)
- Category (optional)
- Merchant Name (optional)

Transaction Form
Currency Standardisation
To visualise transactions with multiple currencies, all transactions should be standardised to one currency for a fair comparison. Currency pairs and their rates are being stored on BudgetHub in order for conversions to the home currency (USD) to be calculated.

Since rates fluctuate over time, BudgetHub allows users to refresh the rates by integrating with ExchangeRate-API’s Standard API. (Thanks Dom @dom_five for the blog post on API integration!)
Overview Dashboard

Budgeting is very important in managing one’s finances. BudgetHub is a helpful and convenient tool in making budgeting easier for users. Users can access the Overview dashboard to get an aggregated view of their historical transactions and how their total balance changed over time.
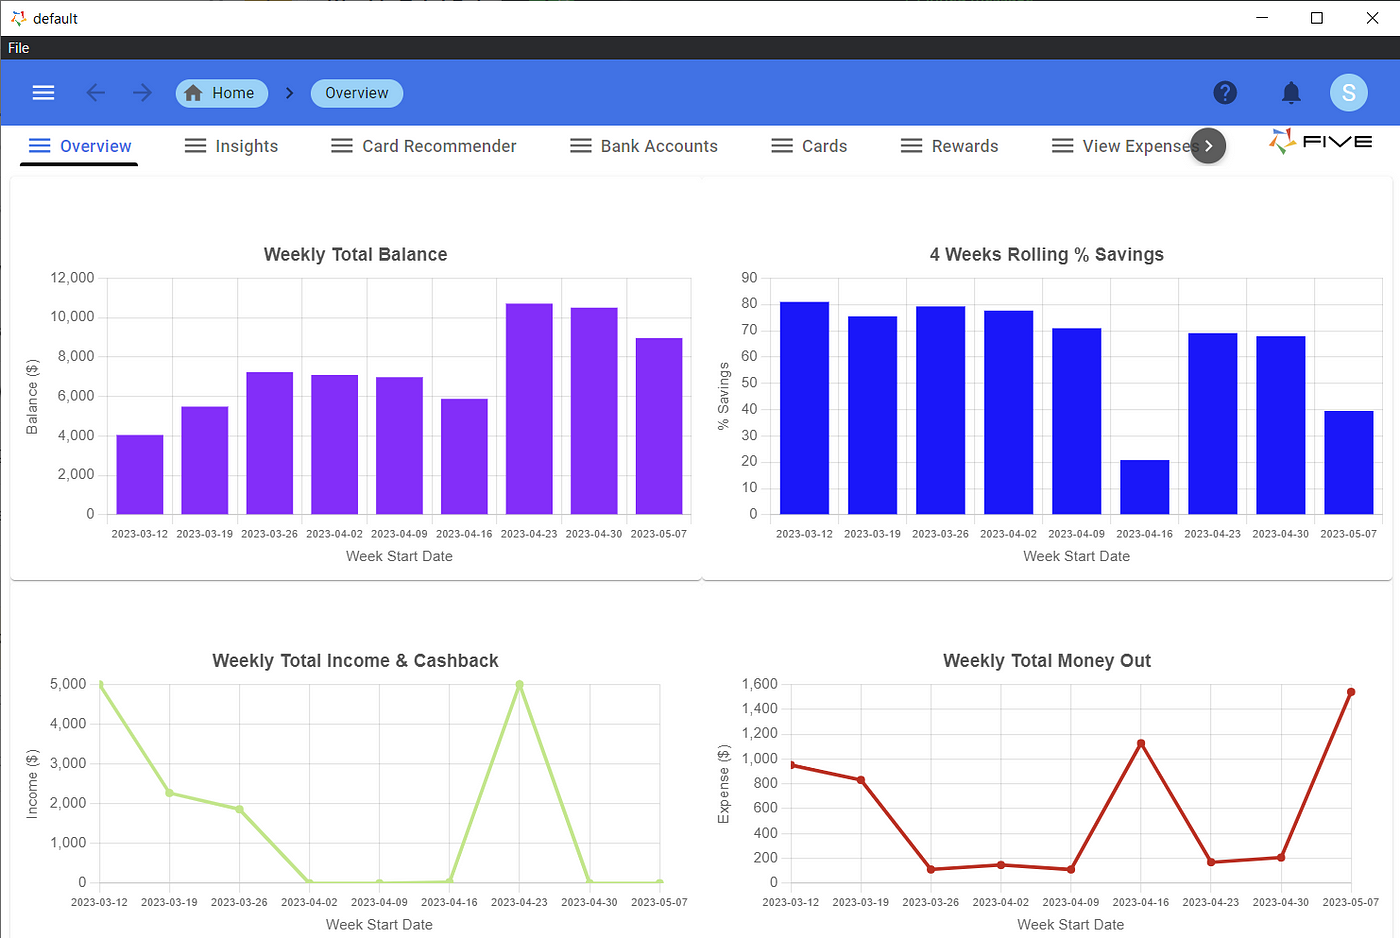
The total balance is the start-of-week balance of their bank accounts, less the spend on their cards. The four weeks rolling percentage savings, calculated by deducting the expenses from incomes (numerator) over the incomes (denominator), are also calculated and visualised in a bar chart. These will allow users to monitor their savings progress easily. Following the 50–30–20 budgeting rule, one should aim to save at least 20% of their savings.
Referencing the 4 weeks rolling percentage savings chart, and assuming the user receives their monthly salary at about the 20th of each month, the user saved about 75% of their salary in March, but only saved about 20% in April.
At a glance, users can monitor their financial inflows and outflows too, identifying periods where spend is higher.
Insights Dashboard

For those who want to find out more about their finances, the Insights dashboard provides just that.
Here, the top 5 categories (with the rest grouped under Others) is plotted, giving users the ability to quickly see what they spend on the most. The weekly percentage change in savings is derived from the weekly total balance, while the weekly estimated points and cashback are calculated with Rewards.
Rewards: Cashback and Points

Too many credit cards, too many perks and too many hoops to jump through? BudgetHub is here to help. We want to help users store, track and compare all these information in one application.
On top of recording transactions made on cards, users can also store their card perks and their benefits in the Rewards menu, such as the cashback percentage for certain merchant categories, and the minimum spend to qualify for the cashback.
The following fields are captured in the cashback and points tables:
- Category (optional)
- Merchant Name (optional)
- Currency
- Minimum Spend (optional)
- Percentage (cashback) / Points per Unit (points)
- Constant (optional)
For instance, the criteria for points is 10 points plus 1.5 points per dollar with a minimum spend of US$100. The currency will be USD, minimum spend will be 100, points per unit will be 1.5 and constant will be 10.
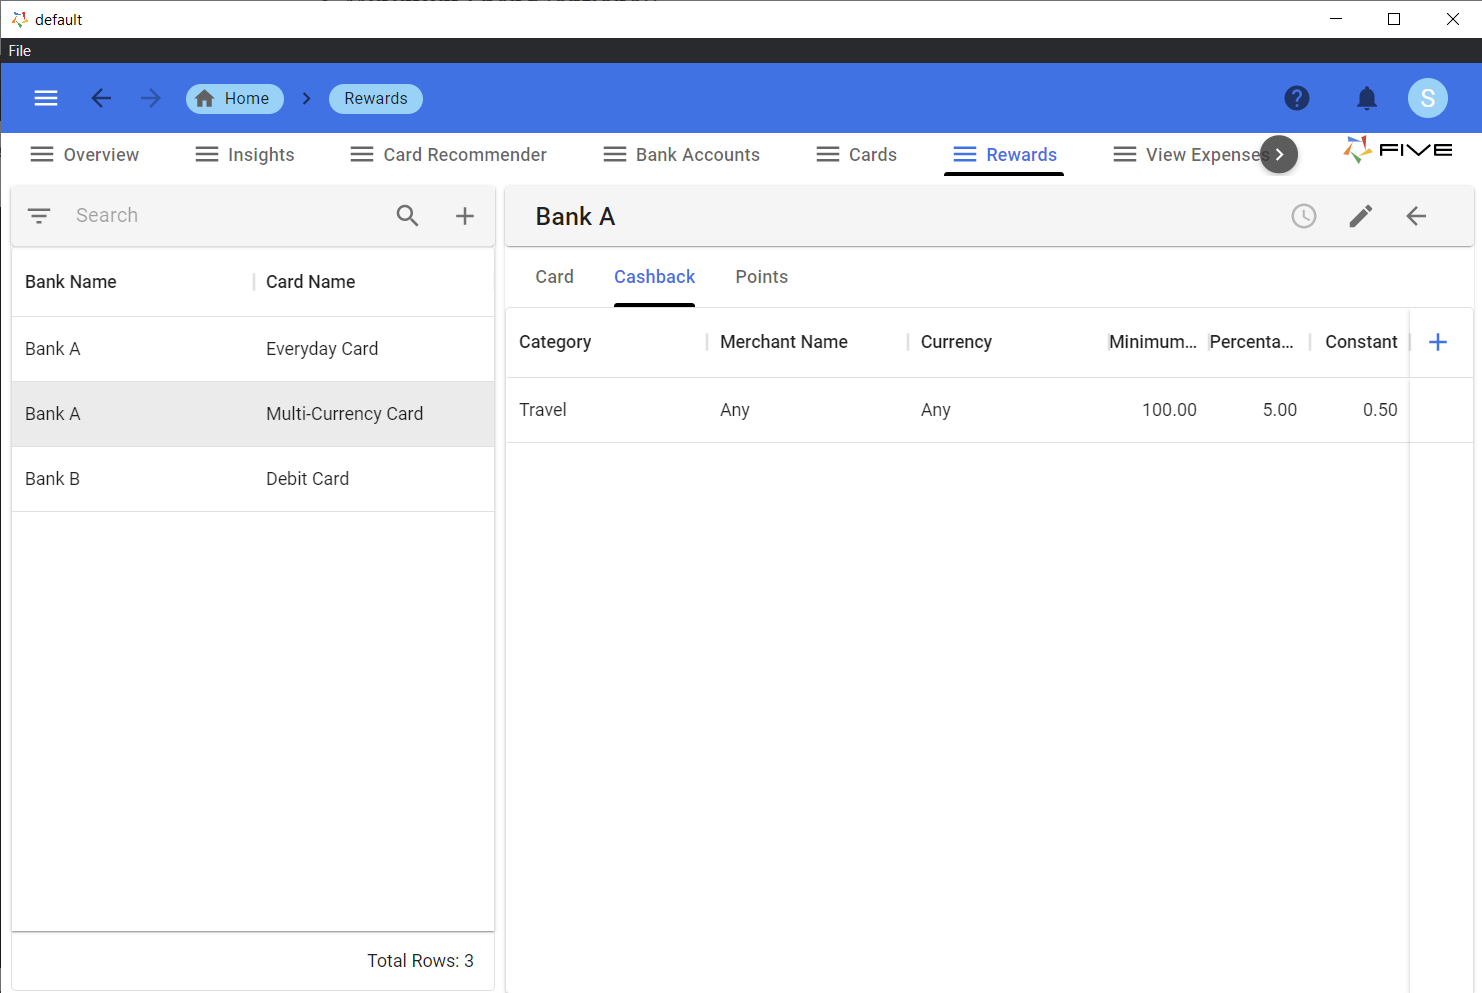
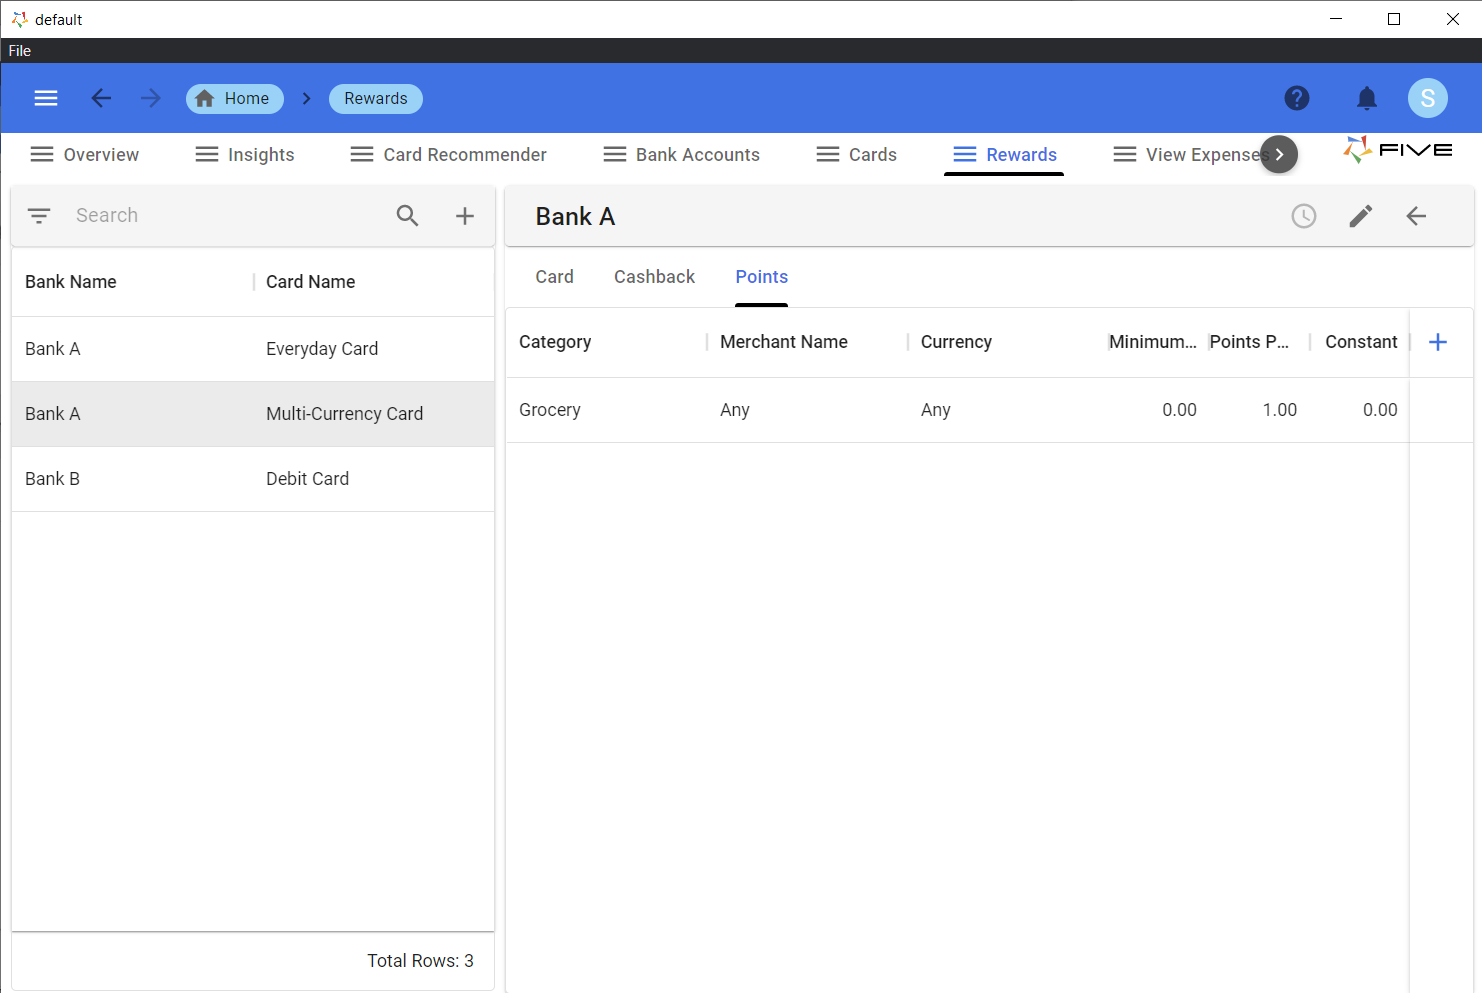
Still a hassle to go through the perks that were recorded to select the best card for your purchase? Look for Card Recommender.
Card Recommender
The Card Recommender does exactly what it does — recommend the best card for cashback and points based on transaction attributes. Simply fill in the amount, currency, category and merchant name (if applicable), and it will show all the perks that your cards can give. All that is left is to decide what’s best and make that transaction!
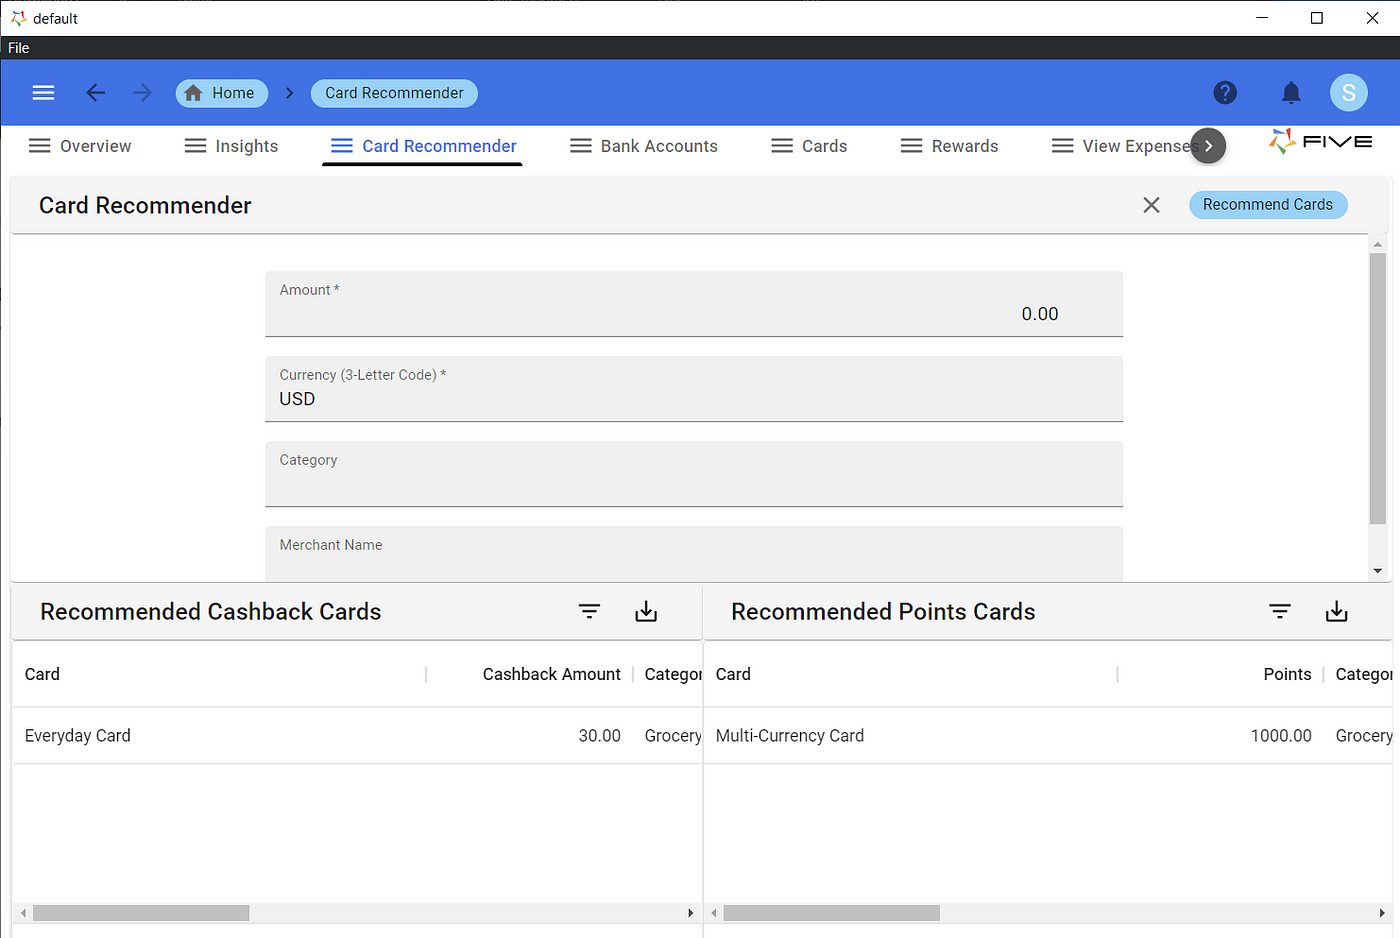
The card recommendations for both points and cashback are sorted in descending order, so the first card on each list is the best card to use for each reward type.
Conclusion
That’s what BudgetHub is. A simple, user-friendly application that stores transactions, maps them to the bank account or card, and visualises one’s cashflow. Furthermore, it has refreshable currency exchange rates for a uniform comparison, and the ability to recommend the best card for each transaction for the most savings.
We hope that end-users will be able to track and visualise their savings, progressing toward their financial goals.
Developer Notes
The following are some design and engineering assets that we would like to showcase.
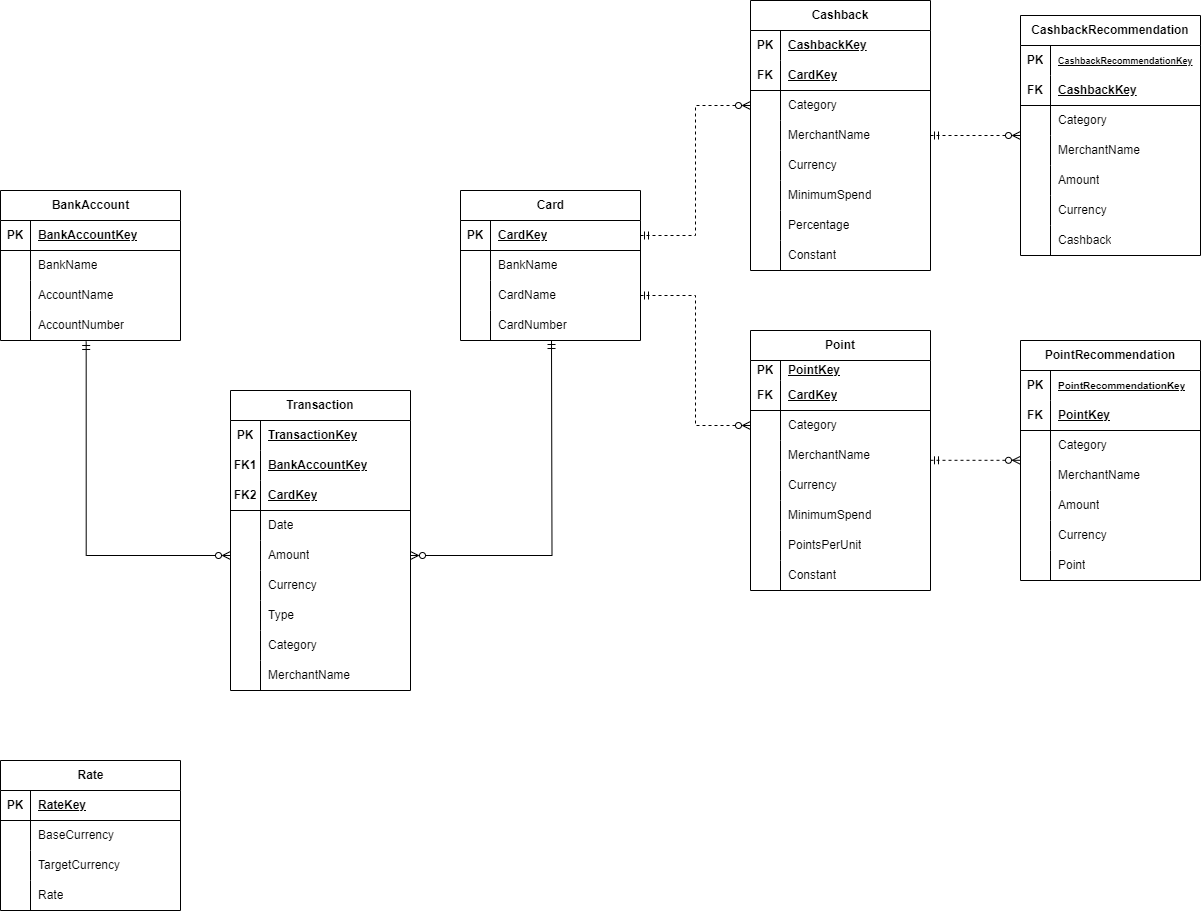
Entity-Relationship Diagram (ERD)
The following diagram shows how the database is structured.
Four Weeks Rolling Percentage Savings Query
This query is used for the Four Weeks Rolling Percentage Savings chart in the Overview dashboard. We first standardise all transaction amounts to US Dollar, before calculating the weekly inflow and outflow. The four week rolling numbers are then calculated, then deriving the percentage savings.
WITH transaction_standardised AS (
    SELECT
        Date,
        (CASE WHEN Currency = "USD" THEN Amount ELSE Amount * (1 / Rate.Rate) END) AS Amount,
        Type
    FROM
        Transaction
    LEFT JOIN
        Rate
    ON
        Transaction.Currency = Rate.TargetCurrency
),
inflow_outflow AS (
    SELECT
        WEEK(Date, 2) as week_number,
        CASE
            WHEN WEEKDAY(Date) <> 6
                THEN DATE_FORMAT(DATE_SUB(Date, INTERVAL WEEKDAY(Date) + 1 DAY), GET_FORMAT(DATE, 'ISO'))
            ELSE DATE_FORMAT(Date, GET_FORMAT(DATE, 'ISO'))
        END as week_start_date,
        SUM(CASE WHEN Type = "Income" THEN Amount ELSE 0 END) AS inflow,
        SUM(CASE WHEN `Type` = "Expense" THEN Amount ELSE 0 END) AS outflow,
        ROW_NUMBER() OVER (ORDER BY WEEK(Date, 2)) AS row_num
    FROM transaction_standardised
    GROUP BY 1, 2
),
rolling_inflow_outflow AS (
    SELECT
        week_number,
        week_start_date,
        SUM(inflow) OVER (ORDER BY row_num ROWS BETWEEN 3 PRECEDING AND CURRENT ROW) AS rolling_inflow,
        SUM(outflow) OVER (ORDER BY row_num ROWS BETWEEN 3 PRECEDING AND CURRENT ROW) AS rolling_outflow,
        row_num
    FROM inflow_outflow
)
SELECT
    week_number,
    week_start_date,
    rolling_inflow,
    rolling_outflow,
    IF(rolling_inflow = 0 OR rolling_outflow > rolling_inflow,
        0,
        ROUND((rolling_inflow - rolling_outflow) / rolling_inflow * 100, 2)) AS savings_percentage,
    row_num
FROM rolling_inflow_outflow
Weekly Percentage Change in Savings Query
This query is used for the Weekly Percentage Change in Savings chart in the Insights dashboard. Like the previous query, we first standardise all transaction amounts to US Dollar, before calculating the weekly inflow and outflow. The results are then joined and the weekly percentage change is calculated using LAG().
WITH transaction_standardised AS (
    SELECT
        Date,
        (CASE WHEN Currency = "USD" THEN Amount ELSE Amount * (1 / Rate.Rate) END) AS Amount,
        Type
    FROM
        Transaction
    LEFT JOIN
        Rate
    ON
        Transaction.Currency = Rate.TargetCurrency
),
weekly_money_in AS (
    SELECT
        WEEK(Date, 2) AS week_number_in,
        CASE
            WHEN WEEKDAY(Date) <> 6
                THEN DATE_FORMAT(DATE_SUB(Date, INTERVAL WEEKDAY(Date) + 1 DAY), GET_FORMAT(DATE, 'ISO'))
            ELSE DATE_FORMAT(Date, GET_FORMAT(DATE, 'ISO'))
        END AS week_start_date_in,
        SUM(CASE WHEN Type IN ('Income', 'Cashback') THEN Amount ELSE 0 END) AS amount_in
    FROM
        transaction_standardised
    GROUP BY
        week_number_in, week_start_date_in
),
weekly_money_out AS (
    SELECT
        WEEK(Date, 2) AS week_number_out,
        CASE
            WHEN WEEKDAY(Date) <> 6
                THEN DATE_FORMAT(DATE_SUB(Date, INTERVAL WEEKDAY(Date) + 1 DAY), GET_FORMAT(DATE, 'ISO'))
            ELSE DATE_FORMAT(Date, GET_FORMAT(DATE, 'ISO'))
        END AS week_start_date_out,
        SUM(CASE WHEN Type = 'Expense' THEN Amount ELSE 0 END) AS amount_out
    FROM
        transaction_standardised
    GROUP BY
        week_number_out, week_start_date_out
),
combined_result AS (
    SELECT
        combined.week_number_in,
        combined.week_start_date_in,
        combined.week_number_out,
        combined.week_start_date_out,
        ROUND(combined.amount_in, 2) AS amount_in,
        ROUND(combined.amount_out, 2) AS amount_out,
        ROUND(SUM(combined.amount_in - combined.amount_out) OVER (ORDER BY combined.week_start_date_in), 2) AS weekly_total_balance
    FROM (
        SELECT *
        FROM weekly_money_in
        LEFT JOIN weekly_money_out ON weekly_money_in.week_start_date_in = weekly_money_out.week_start_date_out
        UNION
        SELECT *
        FROM weekly_money_in
        RIGHT JOIN weekly_money_out ON weekly_money_in.week_start_date_in = weekly_money_out.week_start_date_out
    ) AS combined
),
percentage_savings AS (
    SELECT
        week_start_date_in,
        week_number_in,
        amount_in,
        amount_out,
        weekly_total_balance,
        ROUND(((weekly_total_balance - LAG(weekly_total_balance) OVER (ORDER BY week_start_date_in ASC)) / weekly_total_balance) * 100, 2) AS percentage_savings_per_week
    FROM combined_result
)
SELECT
    week_number_in as week_number,
    week_start_date_in as week_start_date,
    amount_in,
    amount_out,
    weekly_total_balance,
    percentage_savings_per_week
FROM percentage_savings
ORDER BY week_start_date_in ASC
Recommend Cards Function
RecommendCards() queries both the Cashback and Point tables for eligible rewards, then calculating them respectively and inserting into the CashbackRecommendation and PointRecommendation tables respectively.
function RecommendCards(five: Five, context: any, result: FiveError) : FiveError {

    const amount: number = Number(context.Amount);

    // Query tables
    const sqlStatement1: string = `
        SELECT CashbackKey, Percentage, Constant
        FROM Cashback
        WHERE
            ? >= MinimumSpend AND Currency IN (?, "Any") AND
            (
                (Category = ? AND MerchantName = "Any") OR
                (Category = "Any" AND MerchantName = ?)
            )`;
    const queryresults1: QueryResult = five.executeQuery(sqlStatement1, 0,
        amount,
        context.Currency,
        context.Category,
        context.MerchantName);

    const sqlStatement2: string = `
        SELECT PointKey, PointsPerUnit, Constant
        FROM Point
        WHERE
            ? >= MinimumSpend AND Currency IN (?, "Any") AND
            (
                (Category = ? AND MerchantName = "Any") OR
                (Category = "Any" AND MerchantName = ?)
            )`;;
    const queryresults2: QueryResult = five.executeQuery(sqlStatement2, 0,
        amount,
        context.Currency,
        context.Category,
        context.MerchantName);

    if (queryresults1.values === null && queryresults2.values === null) {
        return five.createError(queryresults2, "No cards offer cashback or points for this spend");
    }

    five.executeQuery("DELETE FROM CashbackRecommendation", 0);
    five.executeQuery("DELETE FROM PointRecommendation", 0);

    // Calculate cashback
    if (queryresults1.values !== null) {
        const insertSqlStatement: string = `
            INSERT INTO CashbackRecommendation
            (
                CashbackRecommendationKey,
                CashbackKey,
                Category,
                MerchantName,
                Amount,
                Currency,
                CashbackAmount
            ) VALUES (?, ?, ?, ?, ?, ?, ?)
        `

        for (let i = 0; i < queryresults1.values.length; i++) {
            const row = queryresults1.values[i];
            const percentage: number = Number(row.Percentage);
            const constant: number = Number(row.Constant);

            const cashback: number = amount * percentage / 100.0 + constant;

            five.executeQuery(insertSqlStatement, 0,
                five.uuid(),
                row.CashbackKey,
                context.Category,
                context.MerchantName,
                amount,
                context.Currency,
                cashback
            );
        }
    }

    // Calculate points
    if (queryresults2.values !== null) {
        const insertSqlStatement: string = `
            INSERT INTO PointRecommendation
            (
                PointRecommendationKey,
                PointKey,
                Category,
                MerchantName,
                Amount,
                Currency,
                Point
            ) VALUES (?, ?, ?, ?, ?, ?, ?)
        `

        for (let i = 0; i < queryresults2.values.length; i++) {
            const row = queryresults2.values[i];
            const pointsPerUnit: number = Number(row.PointsPerUnit);
            const constant: number = Number(row.Constant);

            const points: number = amount * pointsPerUnit + constant;

            five.executeQuery(insertSqlStatement, 0,
                five.uuid(),
                row.PointKey,
                context.Category,
                context.MerchantName,
                amount,
                context.Currency,
                points
            );
        }
    }

    return five.success(result);
}
Get Rates Function
GetRates() retrieves all exchange rates from US Dollar (USD) from ExchangeRate-API’s Standard API and stores them in the Rate table.
function GetRates(five: Five, context: any, result: FiveError) : FiveError {
    const API_URL = `https://v6.exchangerate-api.com/v6/<API_KEY>/latest/USD`
    const client = five.httpClient();
    let httpResult = client.get(API_URL);

    if (httpResult.response === null) {
        return five.createError(httpResult, "Error in retrieving rates");
    }

    const rates = httpResult.response.conversion_rates;

    const insertSqlStatement: string = `
        INSERT INTO Rate
        (
            RateKey,
            BaseCurrency,
            TargetCurrency,
            Rate
        ) VALUES (?, ?, ?, ?)
    `

    Object.keys(rates).forEach(targetCurrency => {
        five.executeQuery(insertSqlStatement, 0,
            five.uuid(),
            "USD",
            targetCurrency,
            rates[targetCurrency]
        );
    })

    return five.success(result, "Rates refreshed");
}
BudgetHub is jointly developed by Jia Hwee Wong and Rui Qin Ng on Five version 2.1.0.


