How To Build a Data Analytics Dashboard [Full Tutorial]
Building a data analytics dashboard can be a daunting task, especially when you need to manage data from multiple sources and present it in a user-friendly manner. Fortunately, Five offers a powerful and rapid development environment that simplifies this process.
In this step-by-step guide, we’ll walk you through building a responsive data analytics dashboard that connects to a REST API, visualizes the data, and provides interactive features for end-users.
What Is a Data Analytics Dashboard?
A data analytics dashboard is a visual representation of key performance indicators (KPIs), metrics, and data points relevant to an organization, department, specific process or business. It consolidates and presents critical information in an easy-to-understand format, such as charts, graphs, tables, and gauges, enabling users to monitor, analyze, and derive insights from their data in real-time.
Who Is This Article For?
This article is great for business analysts, data analysts, managers, executives, IT professionals, entrepreneurs, consultants, and marketers. Those individuals who often work with data and need to communicate insights effectively to drive informed decision-making. Learning how to create visually appealing and interactive dashboards enables you to monitor key performance indicators, identify trends, and optimize strategies based on real-time data. Students and researchers in fields such as business, economics, and data science may also find the article useful for presenting their findings.
Why Build a Data Analytics Dashboard?
When you build a data analytics dashboard using an application builder like Five, the end result is a fully functional web application that goes beyond the capabilities of a simple Excel spreadsheet. This web app offers a range of advantages and features that make it a more powerful and effective tool for data analysis and visualization.
A web app also provides a more user-friendly and interactive experience compared to an Excel dashboard. With features like drill-down capabilities, filters, and interactive charts and graphs, users can easily explore and analyze data at various levels of detail. This interactivity encourages users to engage with the data and uncover valuable insights that might be hidden in static Excel reports.
Furthermore, a data analytics dashboard web app built with Five is highly customizable and can be tailored to match your organization’s branding and specific requirements. You can create a visually appealing and professional-looking dashboard that aligns with your company’s style and color scheme, making it more engaging and intuitive for users. This level of customization is difficult to achieve with Excel’s limited formatting options.
Another advantage of having a proper web app is that it can handle large amounts of data from multiple sources. Five allows you to connect to various databases, APIs and be cloud hosted, enabling you to consolidate and analyze data from different systems in a single dashboard. This data integration ensures that your dashboard provides a comprehensive view of your organization’s performance, rather than relying on data from a single source, as is often the case with Excel dashboards.
Goals and Objectives
By the end of this guide, you’ll have developed a responsive data analytics dashboard connected to the DummyJSON API. The API’s JSON payload will be converted into relational data, displayed on a form, and visualized in a dashboard with multiple charts. Users will be able to interact with the data through the application.
Note: If your data isn’t stored using a REST API with Five you can also build your data analytics dashboard using MySQL, SQL Server, SQLite, or import from Excel/Google Sheets.
Step-by-Step Guide
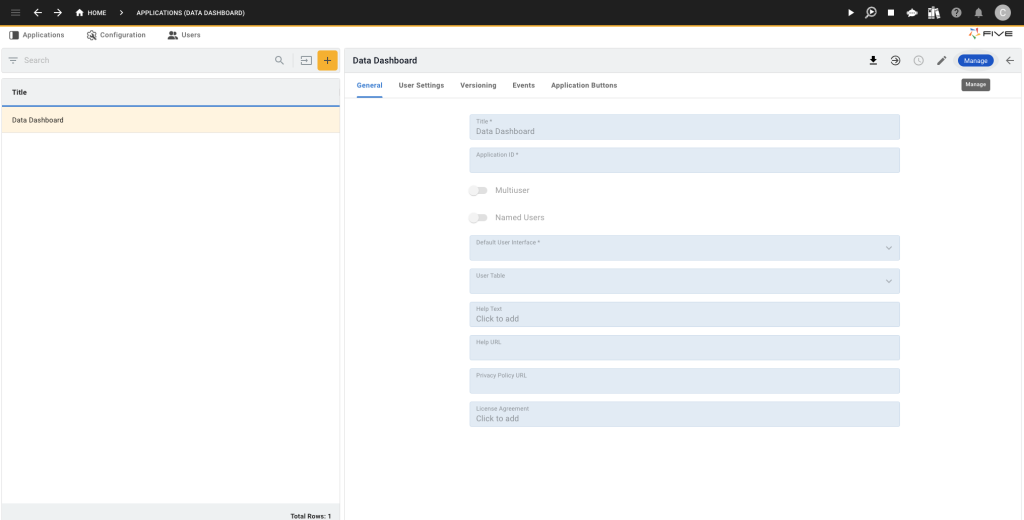
Step 1: Creating a New Application
Sign Up for Free Access to the Five development environment.
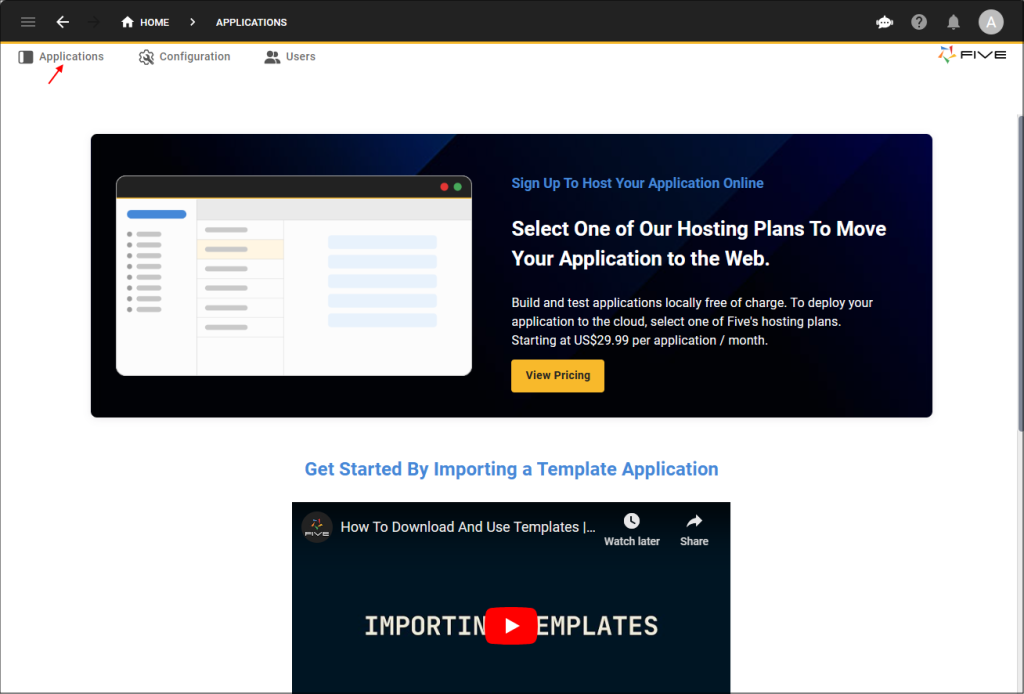
- Click on “Applications” in the top navigation bar.
- Click on the yellow Plus icon.
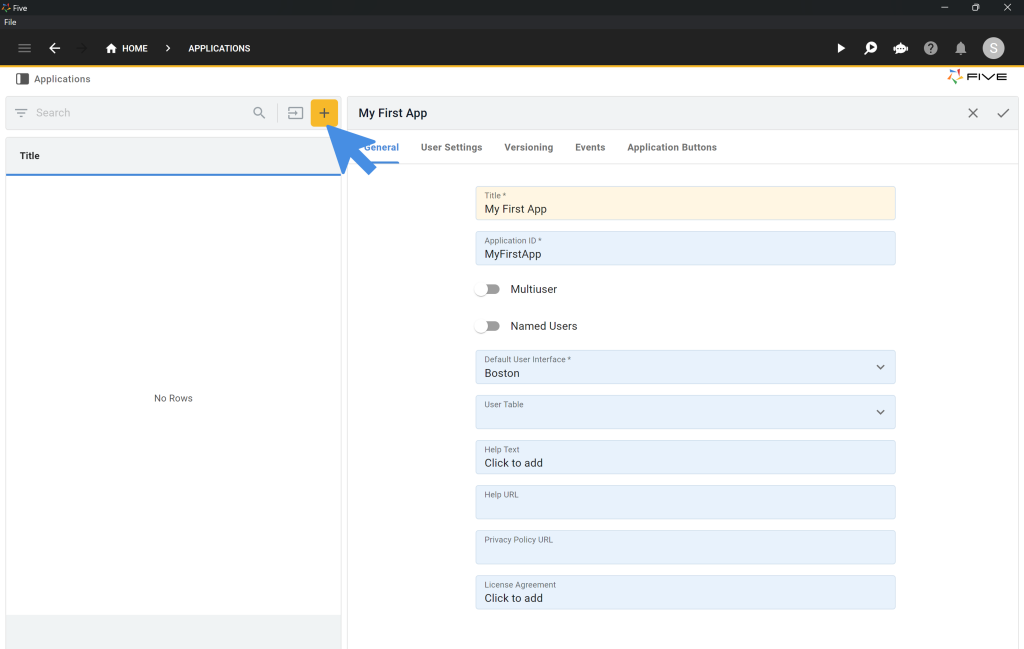
- Name your application “Data Dashboard”.
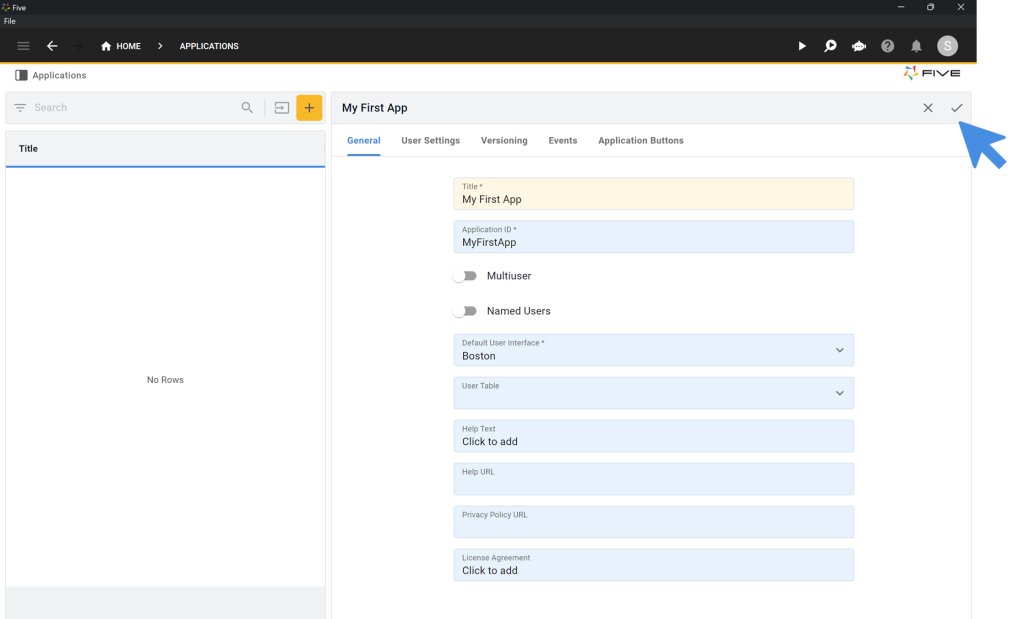
- Save it by clicking the tick mark.
Side Note: Resources and Downloads
Preview The Application Online
To preview the application we are developing online, click here.
Download the Finished Application
Download the finished application as a Five Definition File (FDF) and import it into Five. Once imported, run the application by clicking the “Deploy to Development” button, located in the top-right corner of Five.
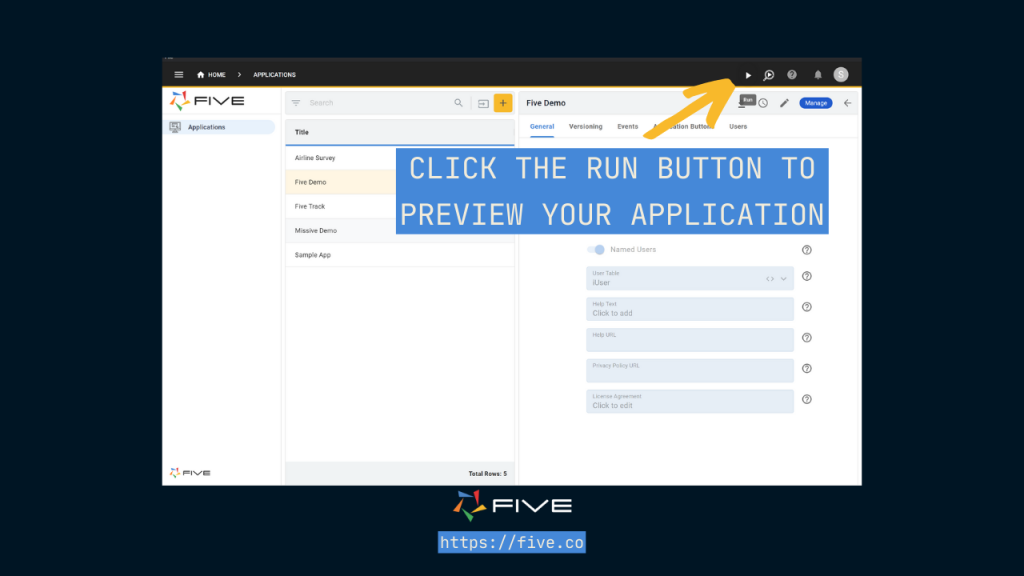
Step 2: Running Your Application
Deploy Your Application:
- Click on the “Deploy to Development” button.
- Five will create a cloud-hosted instance, including a database server and unique URL for your app.
- Once deployed, the button will change to “Run”. Click “Run” to preview your application.
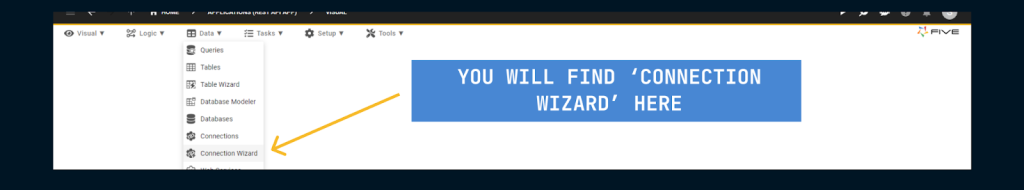
Step 3: Adding an API as a Data Source
- Use the Connection Wizard to connect Five to an external API:
- Click on the blue manage button
- Click on “Data” > “Connection Wizard”.
- Click on “Read List Mapping”.
- Use the DummyJSON API:
https://dummyjson.com/products - Click “Send” to see the API response.
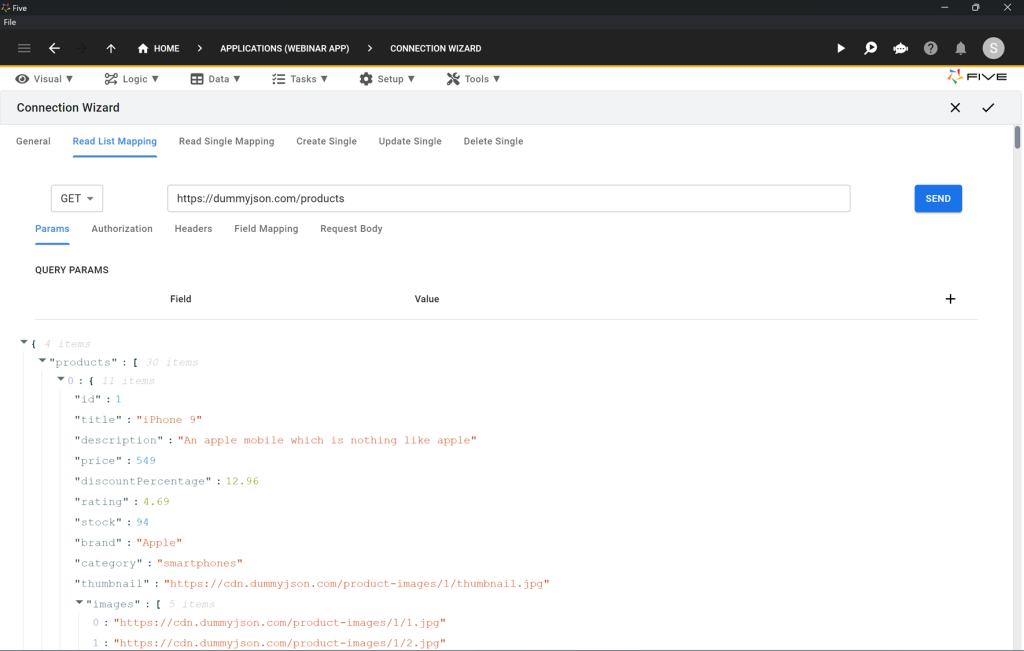
- Go to “Field Mapping” and set the display type for “description” to
_Memo. - Ensure “id” is selected as the Primary Key.
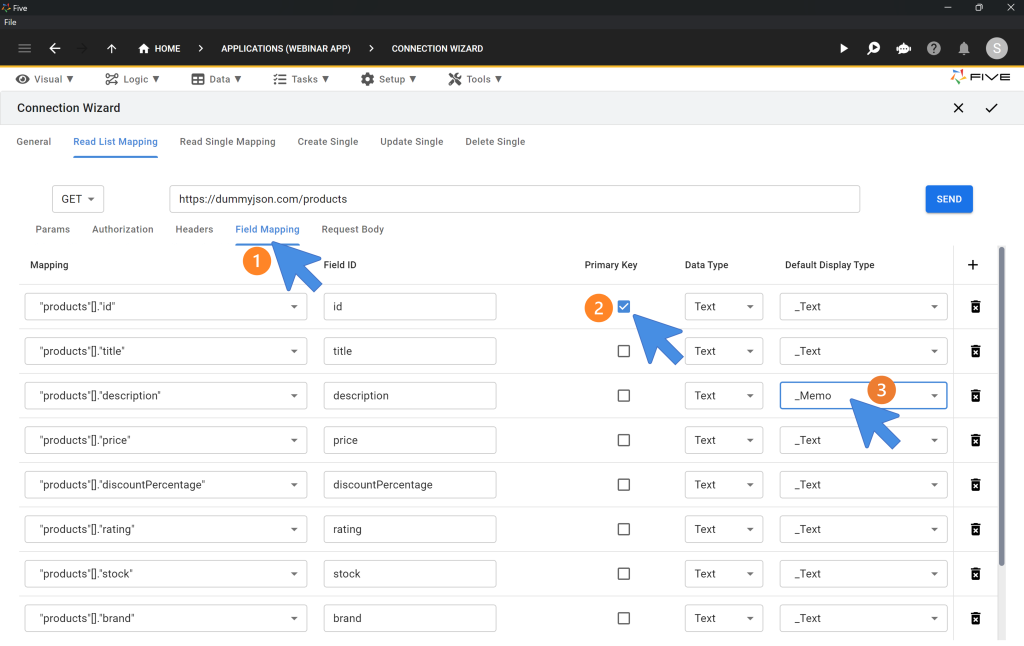
- Click on “Read Single Mapping” and paste
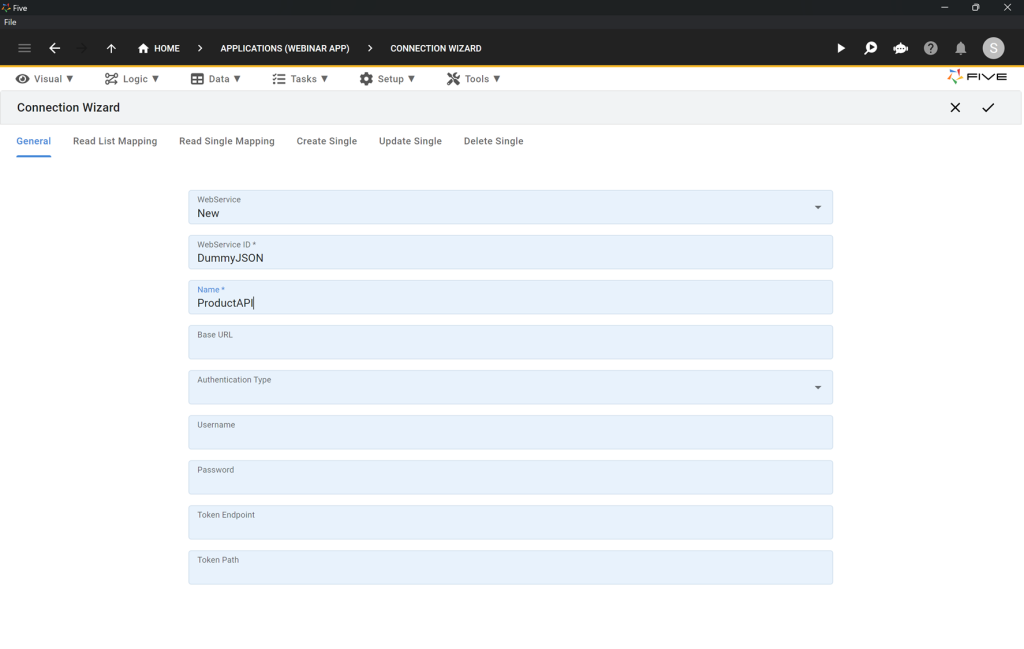
https://dummyjson.com/products/:id. - In “General”, create a new WebService with ID “DummyJSON” and Name “ProductAPI”.
- Save your API connection. Here’s what it should look like so far.
Step 4: Creating a Form on the API
- Use the Form Wizard to create a form:
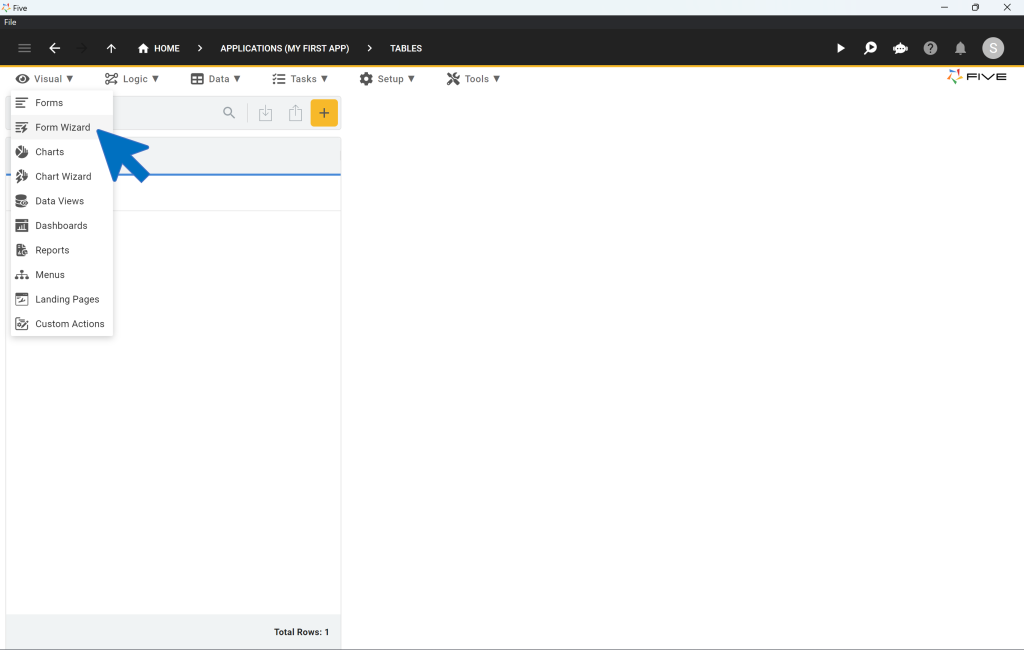
- Click on “Visual” > “Form Wizard”.
- Select “ProductsAPI” as the Main Data Source.
- Name the form “Product Form”.
- Save the form.
First Checkpoint: Run Your Application
- Preview Your Application by clicking the “Run” button.
- Check that the “Product Form” menu item is available.
- Ensure the form displays the API data correctly.
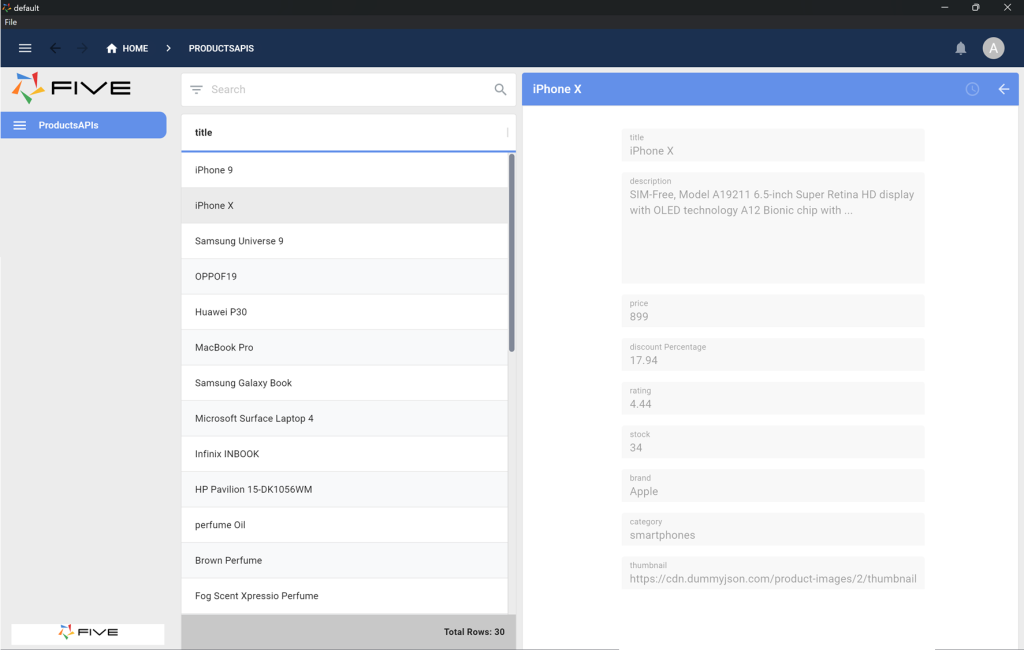
Here’s what your app should look like. On the left, you should now see a new menu item called Product Form (your app will have different colors, because we haven’t themed it yet).
By clicking on Product Form, users can see all of the API’s data in a form created by Five.
Currently, the API returns a total of 30 rows of data. When you click on any of the products sent by the API, you can see its details. Because the API doesn’t let us update or delete products, the forms is read-only. If we had an API endpoint for each HTML method (GET, PATCH/PUT, POST, DELETE), our form could be configured with full create, read, update, and delete permissions.
Step 5: Visualizing the Data from the API
We will now add two charts to our application: a bar chart and a line chart that visualize data received from the API.
- Create Charts using the Chart Wizard:
- Click on “Visual” > “Chart Wizard”.
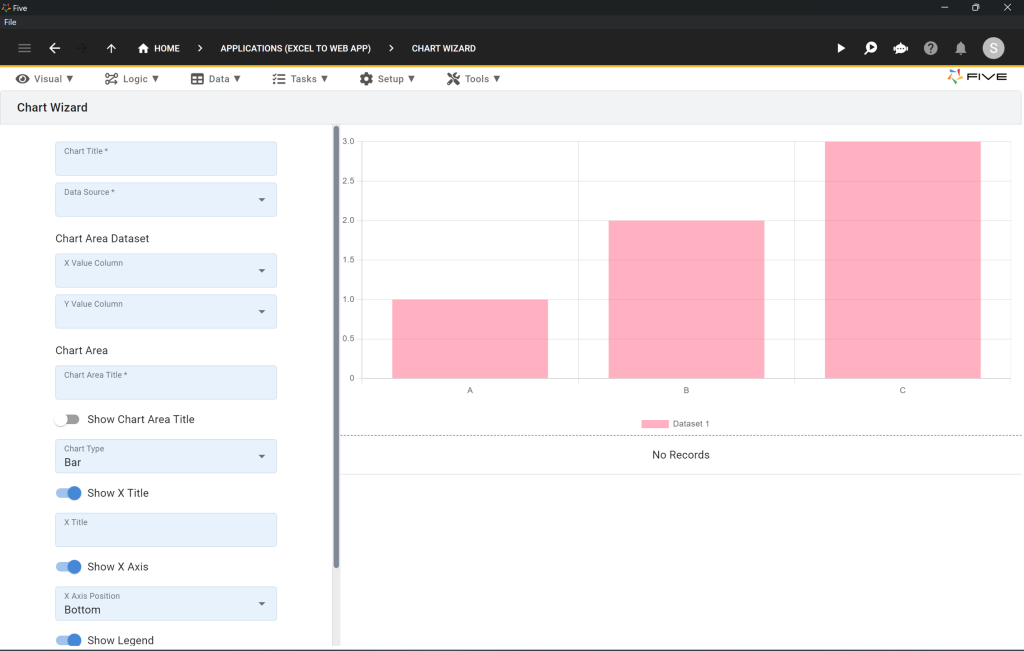
- Create a bar chart for stock data:
- Title: Stock On Hand
- Data Source: ProductAPI
- X Value Column: title
- Y Value Column: stock
- Chart Area ID: StockChart
- Chart Area Title: Stock Chart
- Chart Type: Bar
- Save the chart (click tick)
- Create a line chart for price data:
- Title: Product Prices
- Data Source: ProductAPI
- X Value Column: title
- Y Value Column: price
- Chart Area ID: PriceChart
- Chart Area Title: Price Chart
- Chart Type: Line
- Save the chart (click tick)
Step 6: Combining Multiple Charts in a Dashboard
Navigate to Dashboards:
- Go to “Visual” > “Dashboards”.
- Click on the yellow Plus icon to create a new dashboard.
Configure the Dashboard:
- Fill in the fields as follows:
- Title:
API Dashboard - Columns:
2 - Rows:
2
- Title:
- This setup creates a 2×2 grid to arrange your charts on the dashboard.
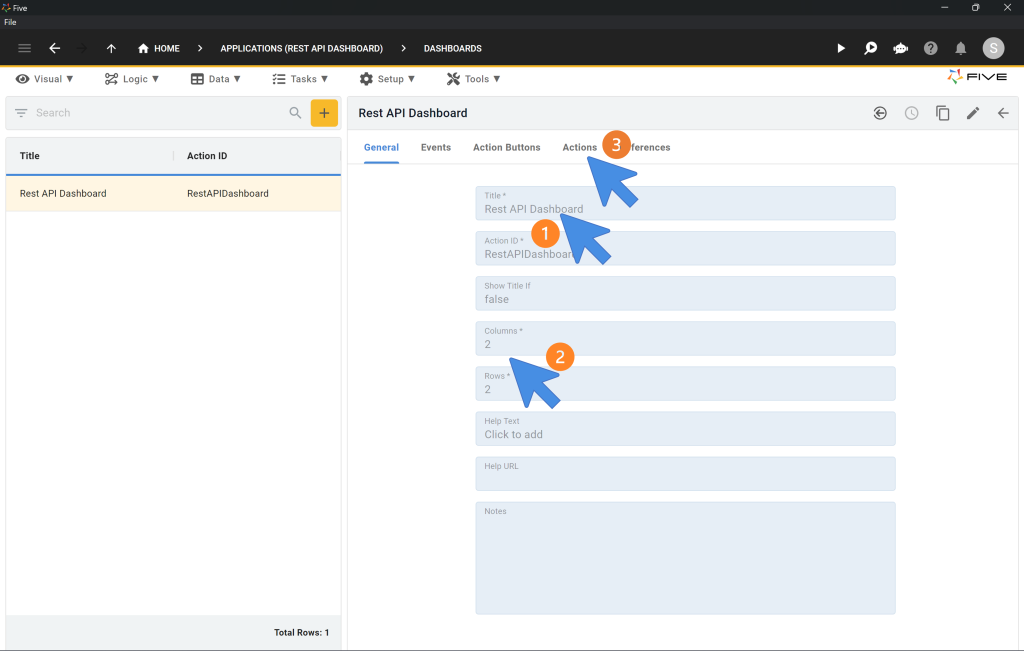
| Title | API Dashboard |
| Columns | 2 |
| Rows | 2 |
Add Actions to the Dashboard:
- Click on “Actions”.
- In the Actions section, click the Plus icon to add new actions.
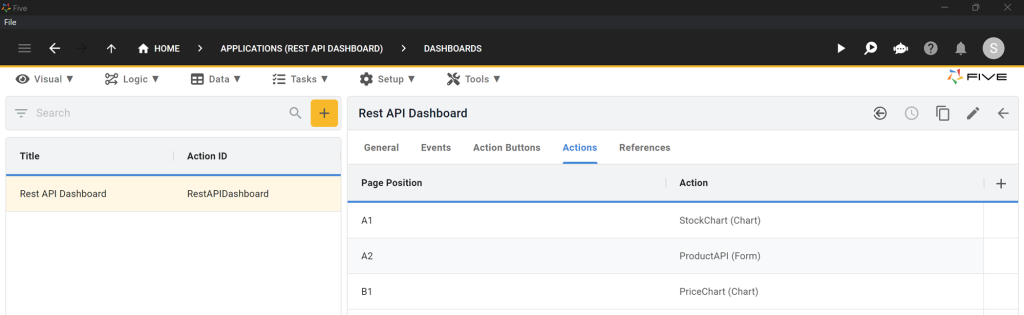
Set Chart Positions:
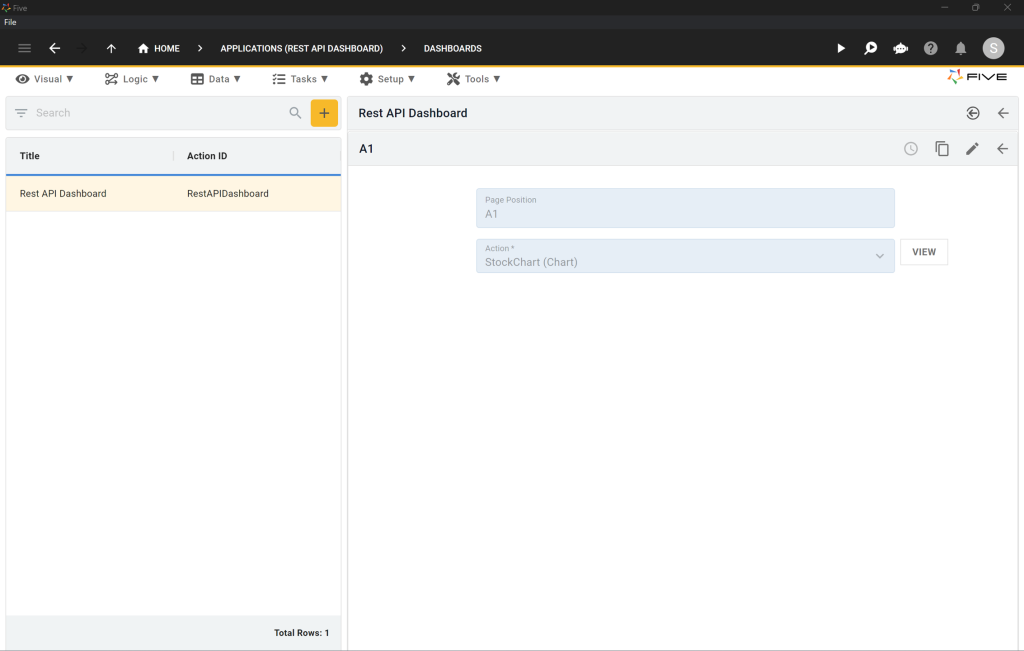
- For Page Position
A1, selectStockChart(Chart) as the Action. Save it by clicking the Tick icon. - For Page Position
B1, selectPriceChart(Chart) as the Action. Save it by clicking the Tick icon. - For Page Position
A2, selectProductAPI(Form) as the Action. Save it by clicking the Tick icon.
Save the Dashboard:
- Finally, save your configured dashboard by clicking the Tick icon.
Step 7: Adding Menu Items to Your App
Add a Menu Item for the Dashboard:
- Go to Visual > Menus.
- Click on the yellow Plus icon.
- Type Dashboard into Caption.
- Type 2 into Menu Order.
- In the Action drop-down select API Dashboard (Dashboard) as the action.
- Click on the Tick icon to save your new menu item.
Second Checkpoint: Run Your Application
- Preview Your Application by clicking the “Run” button.
- Check that the dashboard menu item works and displays the charts correctly.
It’s time to run the application again. Here’s what it should look like (again, your app will have different colors, because it doesn’t have a theme).
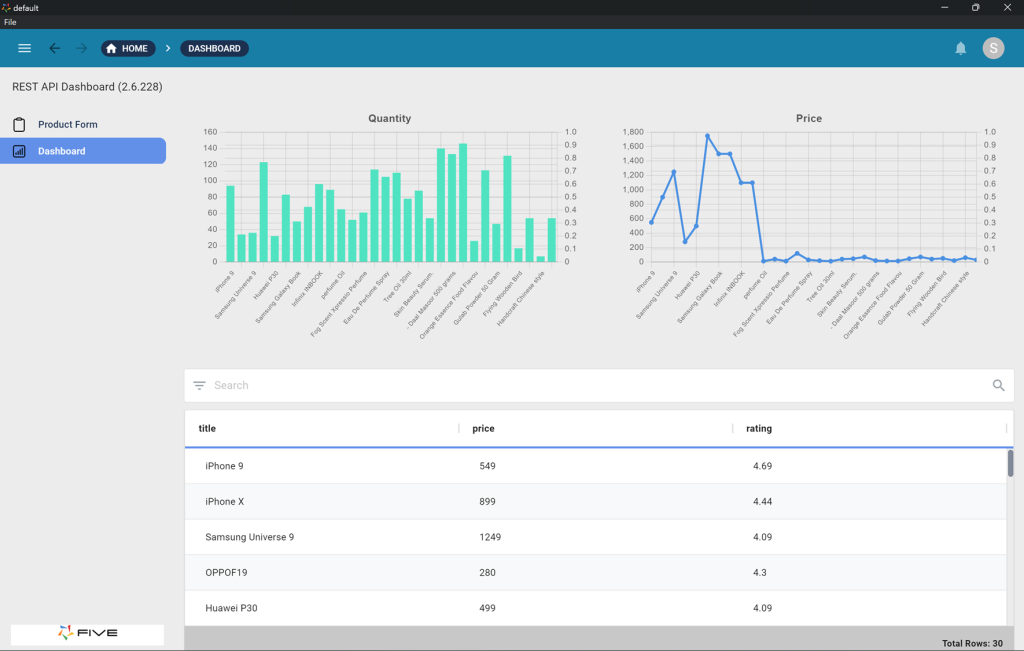
To deploy your data analysis dashboard to the web, sign up for one of our paid plans, starting from US$29.99 per month and application. Your plan includes unlimited end-users and provides you with a custom URL to access the application online.
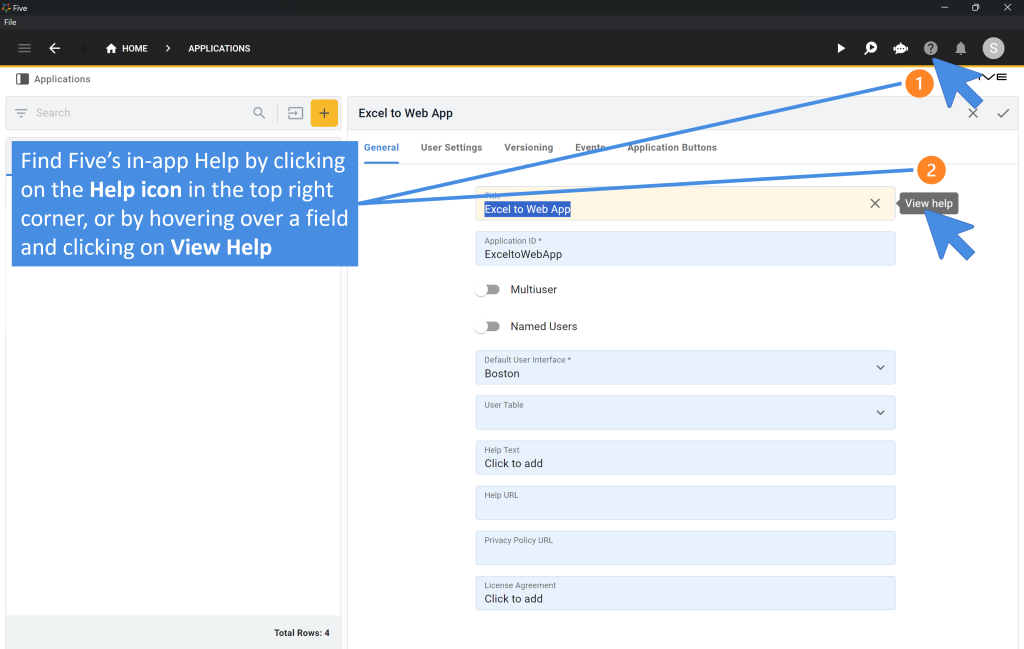
Finding Help in Five
If you need assistance:
- User Community: Visit Five’s User Community.
- Documentation: Visit Five’s Documentation.
- In-App Help: Use Five’s in-app help available in the top right corner.