How To Create Custom Dashboards
Five Labs: How to Create Dashboards in Five
Welcome to Five Labs, a step-by-step guide to building applications using Five.
Dashboards are a powerful tool for visualizing and analyzing data in real time. They provide a comprehensive view of key performance indicators (KPIs) and metrics that are essential for monitoring business performance and making informed decisions. However, building an effective dashboard that genuinely aids decision-making is a challenge.
This lab is designed to guide you through the process of creating a dashboard in Five, leveraging your existing SQL queries and charts.
Table of Contents
Lab Objectives
By the end of this lab, you’ll learn how to build custom dashboards in Five, for today’s tutorial we will be using the query and data view from the How To Execute A Query In SQL session and the chart from the How To Build Charts Using The Chart Wizard
Prerequisites: To participate in this lab, ensure you have:
- Five installed on your system or access to Five on the cloud (with a paid subscription).
- A working SQL query and its data view saved in your application.
- A chart saved in your application.
Don’t Feel Like Reading?
Watch the YouTube video and learn how to build dashboards.
Step 1: Creating The Dashboard
Start by opening Five and loading your application that includes your saved query and chart. To begin building a dashboard, click on ‘Visual‘, then select ‘Dashboards‘ and give your application an appropriate name (for this blog we will refer to it as Product Dashboard).
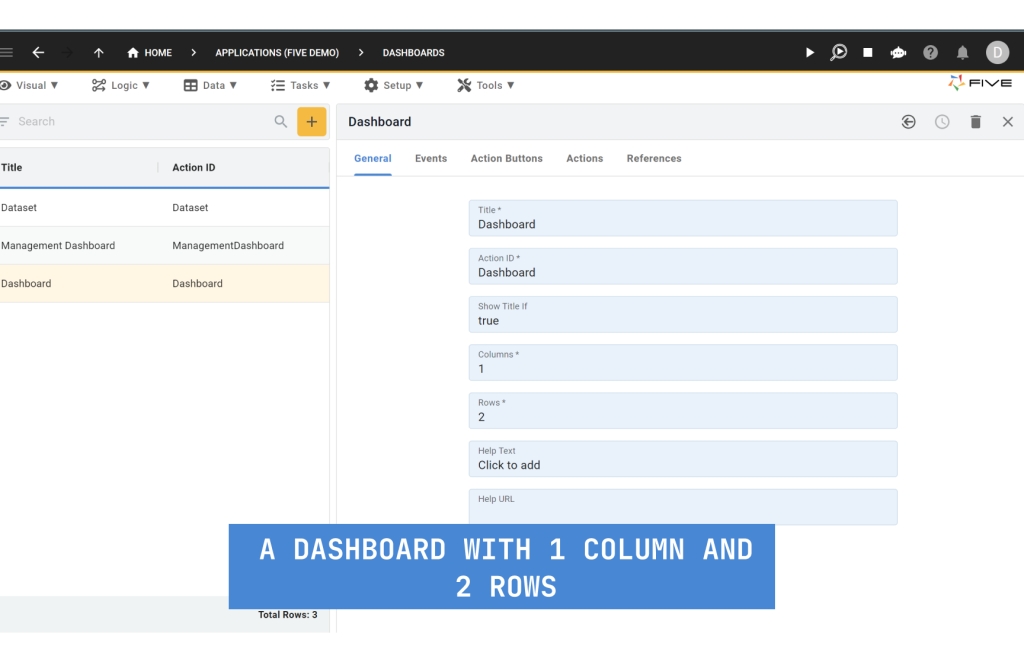
Next, you need to specify the layout of your dashboard, which works like a grid. You can choose how many rows and columns you want to have in your dashboard, depending on how many items you want to display. For example, if you want to show four items, you can have 2 columns and 2 rows, and the layout will look something like this:
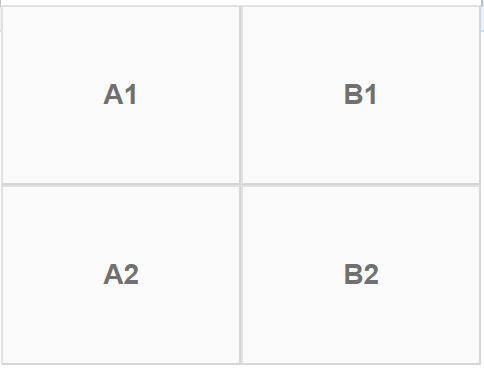
For this session, we will be adding a query and a chart so we will give it a grid of 1 Column and 2 Rows
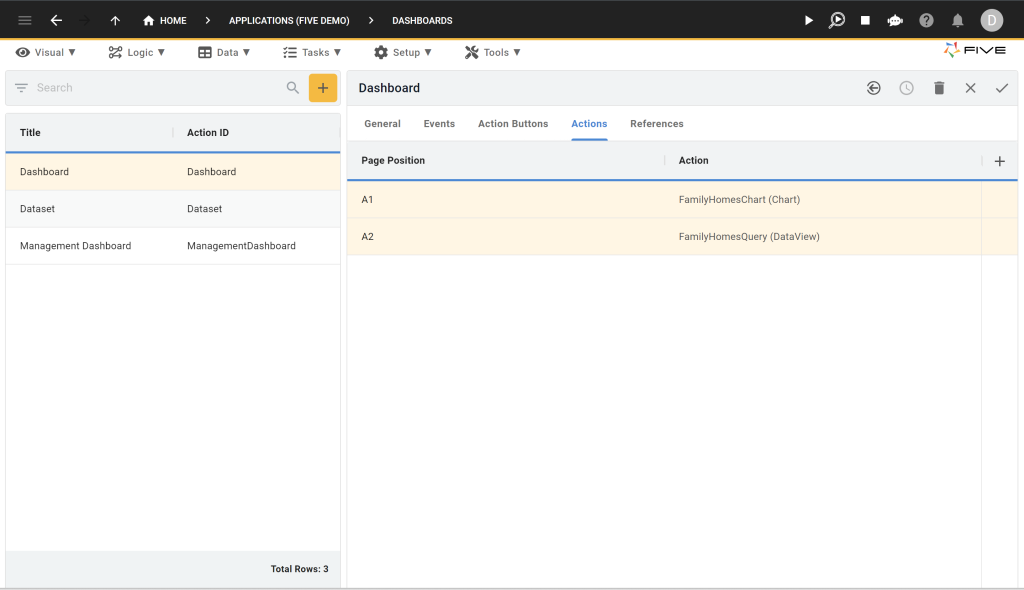
Next, click on the ‘Actions’ tab to begin adding items to our dashboard. Click on the ‘+’ icon, select the desired position in the page position field, followed by selecting the data view that we constructed in the How To Execute A Query In SQL session and next do the same but for charts. After you are done you should have a dashboard with action items like the one shown below:
Step 2: Adding the Dashboard to Your Application
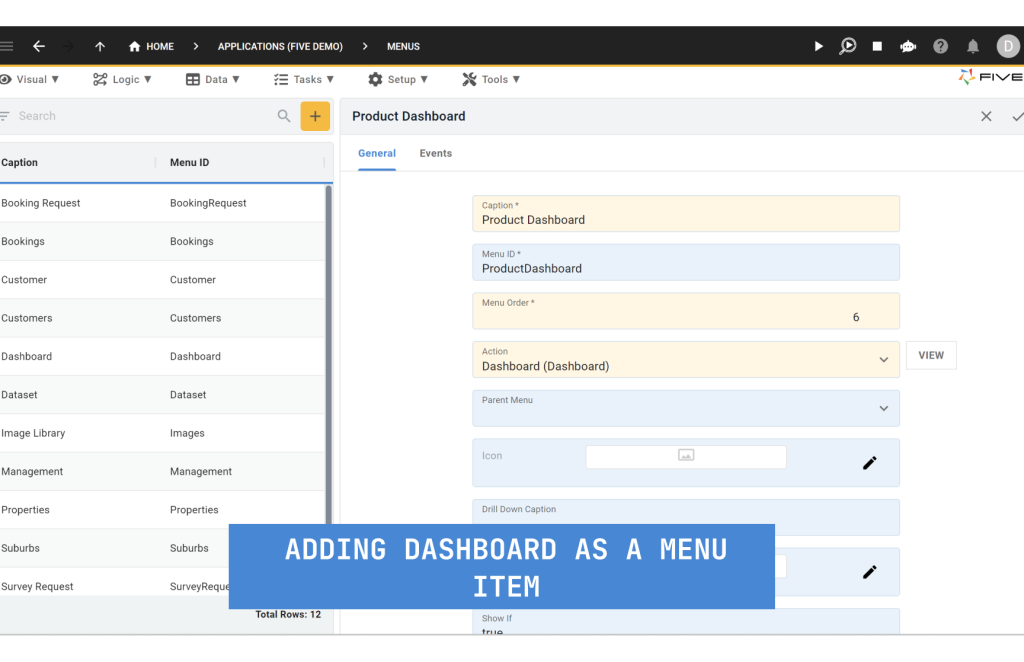
Now that our Dashboard is ready to use let’s add a menu item in your end-user application through which we can view it.
Head over to the ‘Visual’ section again and select ‘Menu’. Here, we’ll create a new menu item. In the ‘Action’ field, select the dashboard that we just made and give it an appropriate name.
Conclusion
Now let’s finally run our application by clicking the play ▶️ button located in the top right corner, as shown below.
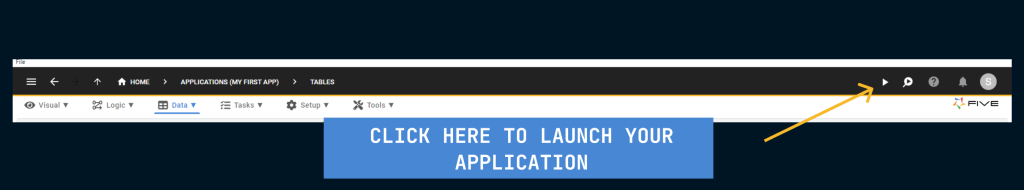
As the application launches, click on the menu item that we just made, and you should have a dashboard on your screen.
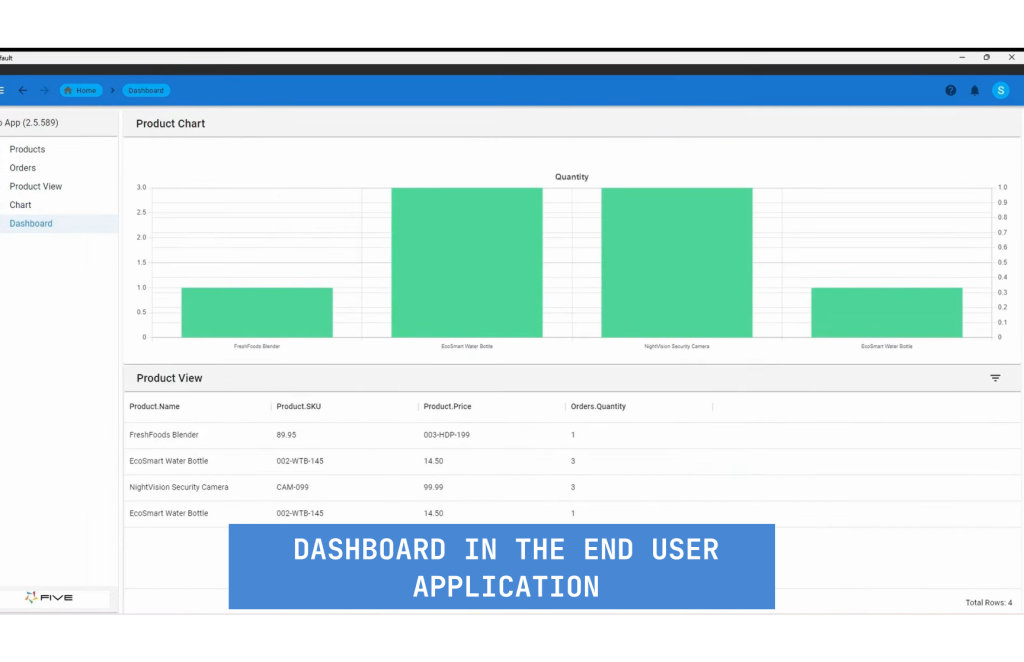
Congratulations, you have successfully added a dashboard to your application!
In this lab, we learned how to create dashboards in Five. We used a SQL query and a chart that we previously built in other labs and added them to a custom layout. We also added a menu item to access our dashboard from the end-user application.
This was just a quick overview of dashboards, now since you know how to create one inside Five, I recommend you download Five and start creating your own applications.
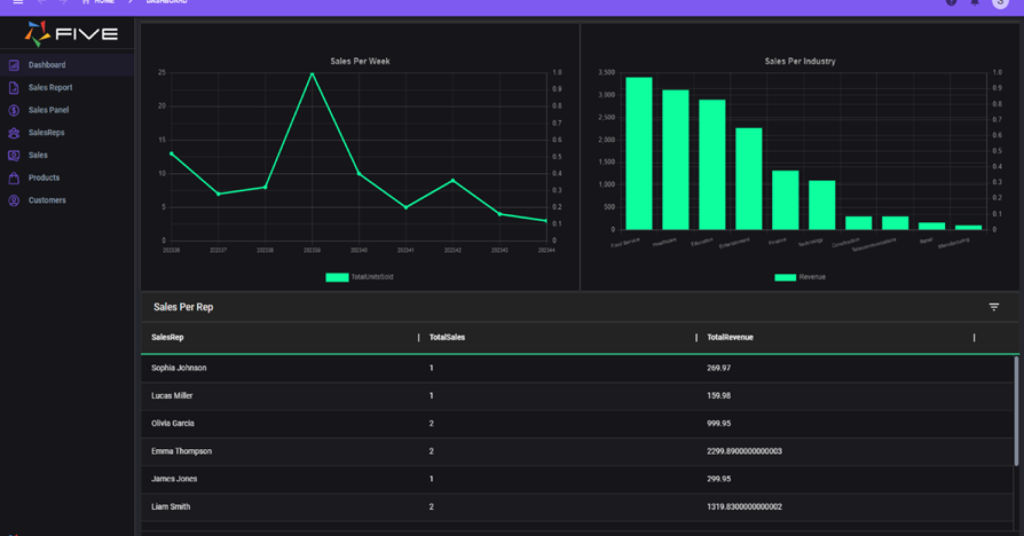
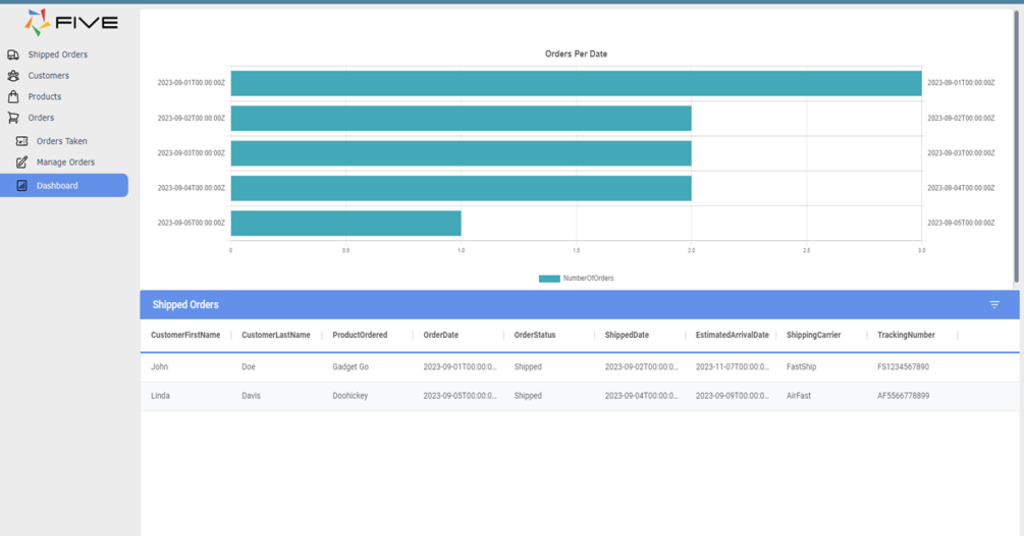
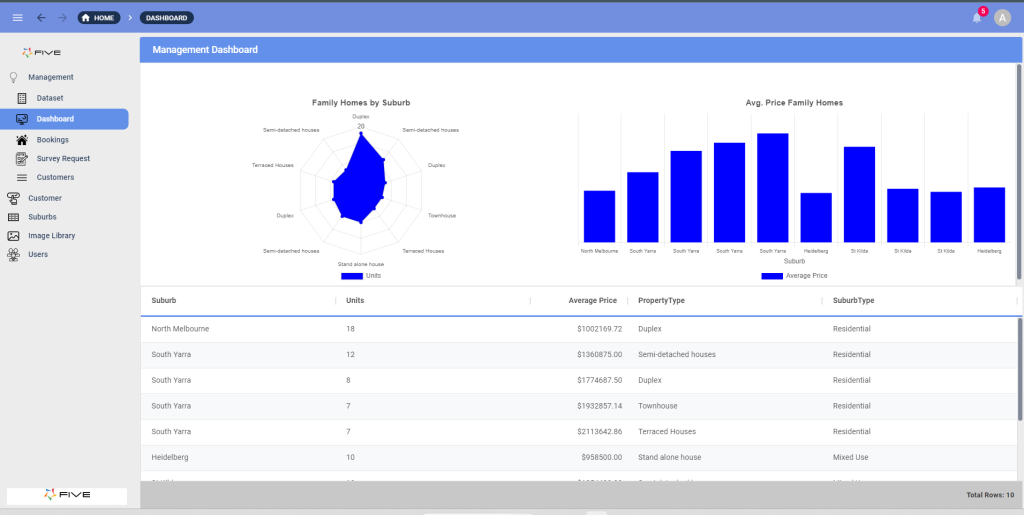
Here are some examples of dashboards created in Five: