Create an Inventory Database in One AI Prompt
Vibe Code Your Inventory Management System: From Idea to Inventory Dashboards in Seconds
An inventory database is crucial for both physical stores and e-commerce businesses. It keeps track of stock levels, FIFO or LIFO, product details, and supplier information, serving as a central source of truth for inventory management. Building a well-structured inventory database can improve your operations and reduce errors.
This step-by-step guide will show you how to build an inventory database so you can forget the days of lost inventory and inaccurate tracking.
2026 Update: Our Copy-and-Paste Inventory Database Prompt
Just a few years ago building a robust inventory database required both skills and time. This has changed. AI app generators like Five let you turn your idea for an inventory database into software in minutes, replacing expensive off-the-shelf SaaS solutions with custom-built systems. Below, we show how you to leverage AI to create your own, ready-to-use inventory database – complete with a sample prompt to get you started!
Table of Contents
- Vibe Code Your Inventory Management System: From Idea to Inventory Dashboards in Seconds
- Why Build an Inventory Database?
- What Is an Inventory Database?
- Create an Inventory Database in One AI Prompt
- From Vision to Reality: 3 Steps to Vibe Code Your Inventory Management System
- AI and Inventory Management Dashboards
- The Inventory Database Schema
- FAQs and Summary
Why Build an Inventory Database?
For inventory managers and business owners, an inventory database is the foundation of smooth operations. It gives you real-time visibility into your stock levels, so you always know what’s available, what’s running low, and what isn’t selling. This means fewer rushed orders, less excess stock taking up space, and better cash flow.
With a centralized system, your team can track orders, monitor supplier performance, and forecast demand more accurately—all without digging through spreadsheets or risking errors. It also simplifies reporting, so you can make decisions based on clear, up-to-date data rather than guesswork.
Put simply, an inventory database helps you stay in control, reduce waste, and keep your customers happy by having the right products ready when they need them.
What Is an Inventory Database?
An inventory database is a structured system that records every detail about the products and the quantities that you carry. A good inventory database goes beyond just tracking quantities—it stores essential attributes like item names, descriptions, prices, sizes, colors, materials, and supplier information. It also tracks practical details like minimum order quantities, packaging specifications, production costs, profit margins, and stock movements.
By centralizing all this information in one searchable system, your inventory database becomes the single source of truth for your business. It eliminates guesswork, reduces errors from manual tracking, and gives you complete visibility into your stock at any moment—helping you make smarter decisions about purchasing, sales, and growth.
Inventory Databases in Excel
More often than not, businesses set up and maintain their inventory databases in Microsoft Excel or Google Sheets.
While these spreadsheet-based solutions are a natural starting point, especially for smaller businesses, a word of caution: these spreadsheets tend to have a life of their own and typically create problems, such as:
❌ Version Confusion:
Different departments or users have their local copy of the spreadsheet (“InventoryDatabase_NEW”, “Inventory Database – v2.1”, “Old Inventory Database – DO NOT USE”, etc.)
❌ Lack of Version and Access Control:
Without clear ownership or version control, changes made by staff can be lost or duplicated, especially if the person responsible for updates leaves the company and a new person takes over.
❌ Data Inconsistencies:
Comments, highlights, and overwrites (how about we mark out-of-stock products in red?).
❌ Security Breaches:
Spreadsheets cannot be easily secured or protected from unauthorized access. Excel or Google Sheets do not directly support user roles, authentication, or granular access control.
Setting up your inventory database as a spreadsheet more often than not defeats its purpose of becoming your single source of truth. Instead, you end up constantly fighting fires and cleaning up spreadsheets. That’s why we recommend creating a proper product database.
Ditch Excel For Better Inventory Management
Excel or spreadsheets aren’t the right solution for inventory management. What’s a better alternative? A secure, login-protected inventory database with an intuitive web user interface!
Create an Inventory Database in One AI Prompt
Tired of juggling spreadsheets and losing track of stock? Why not generate your own inventory database? No complicated setup. No confusing features. Just a clean, straightforward system that lets you:
- Organize products with all the details you need
- Track stock levels in real time
- Get low-stock alerts before it’s too late
All you need to get started is a prompt.
Inventory Database: Sample Prompt
Use the prompt below to quickly set up your inventory management system.
You are an expert database developer and application architect. I need you to design a complete inventory database to track stock levels, product movement, and order management. The system must cover the full inventory lifecycle: receiving, stock management, sales/fulfillment, and reordering.

**Core Requirements:**

**Database Schema:** Design a relational schema with tables for:
- **Products:** Product ID, name, SKU, category, description, unit cost, selling price, reorder point, current quantity
- **Suppliers:** Supplier ID, name, contact info, lead time
- **Inventory Transactions:** Transaction ID, product ID, type (receipt, sale, adjustment, return), quantity, unit cost, date, reference number
- **Purchase Orders:** PO ID, supplier ID, order date, expected date, status, line items with quantities and costs
- **Locations:** Warehouse/bin locations for stock tracking

**Forms:**
- Product Registration Form
- Stock Receiving Form (adds to inventory)
- Stock Adjustment Form (for discrepancies, damage)
- Purchase Order Form

**Reports:**
- Current Stock Levels (by product/location)
- Low Stock Alert (items below reorder point)
- Inventory Valuation (total cost on hand)
- Stock Movement History (audit trail by product)
- Purchase Order Status Report

**Additional Constraints:**
- Prevent negative stock levels
- Track average or FIFO cost methods
- Enforce unique SKU
- Include sample queries for key reports
- Include an example workflow (e.g., receiving a supplier shipment and updating inventory)
Using this prompt in Five, an AI-powered app generator, AI will create a comprehensive inventory database. You can further enhance your database with detailed reports on stock levels, charts to visualize slow and fast moving items, or track stock levels by warehouse or locations. You can also configure alerts to notify you of any items that need to be reordered soon or of perishable items that could benefit from a promotion to accelerate sales.
Sign up now for instant access and generate your inventory database application.
From Vision to Reality: 3 Steps to Vibe Code Your Inventory Management System
Building an inventory database used to require technical knowledge that someone running an e-commerce, managing a warehouse or factory operation might not have. For instance, you’d need a substantial understanding of database languages like SQL, not to mention the front-end development for user interaction.
This complexity often leads small-scale e-commerce operations, manufacturers, and distributors to neglect building an inventory database. They simply don’t have the technical expertise or the time to create it from scratch. This has changed with AI and app generators like Five.
Here are three steps how to plan your inventory database for the best AI-generated results.
Step 1: Map Out Your Data Needs
No one knows your business better than you do – not even AI.
Every business manages inventory differently, whether you’re tracking handmade goods, industrial parts, or retail products. But while your needs are unique, the fundamentals remain the same: real-time stock visibility, accurate tracking, and streamlined operations.
Before you get started, map out your data needs. What data is essential to your business and inventory management? Create a full list.
Step 2: Define Important Features, Reports or Charts
Now that your data needs are clear continue by thinking about the required user interfaces. We recommend prioritizing them by using the MoSCoW framework:
1. Must-Haves: These are the non-negotiable requirements for day-to-day operations and should be part of your v1 release. Depending on your business, these can include, for example:
✅ Barcode/QR scanning for faster stock checks
✅ Automated low-stock alerts with custom thresholds
✅ Multi-location tracking (if managing multiple warehouses)
2. Should-Haves are important but not immediately critical. They can be added later. Examples could be:
✅ Batch/expiry date tracking (for perishable goods)
✅ Supplier performance dashboards
✅ Mobile app access for on-the-go updates
3. Could-Haves are useful but not essential. Only work on these if time or budget allows. Here are a few examples:
✅ AI-driven demand forecasting
✅Custom reporting templates
✅ Third-party integrations (e.g., Shopify, QuickBooks)
4. Won’t-Haves. Won’t have features are often forgotten, but are just as important. These features are deliberately excluded to avoid scope creep, such as
❌ Overly niche features (e.g., chemical compliance tracking for non-manufacturers)
❌ Redundant tools (if your workflow already covers it)
Tip: Revisit this list once a year—today’s “Could-Have” might become tomorrow’s “Must-Have” as you scale.
Step 3: Enhance Your Inventory Database
With your prioritized list of customizations from Step 2, it’s time to refine your inventory system to better fit your business.
Start by implementing the must-have enhancements – these are the critical features that will deliver immediate value, such as barcode scanning for faster stock checks or automated alerts to prevent shortages. Include these in your prompt and let AI generate them early in the process. Test as you go along.
Once these are in place, move on to the should-have improvements, like adding batch tracking or supplier performance insights, which further streamline operations.
For more advanced needs, like third-party integrations or AI-driven forecasting, test them in stages to ensure they align with your processes before full deployment. By taking a structured approach, you ensure each enhancement adds real value—keeping your inventory management efficient, scalable, and tailored to your business as it grows.
AI and Inventory Management Dashboards
Looking at inventory levels visually in dashboards, rather than in rows and columns, is one of the more effective ways to manage inventory successfully. A well-designed dashboard can easily reveal products whose stock levels are running low, reorder levels or seasonal fluctuations in demand.
The foundation of a good dashboard, however, is good data. That’s why step 1 mentioned above, mapping out your inventory data needs, is a critical first step. With the right data stored inside your inventory database, adding a user-friendly and intuitive dashboard is as easy as prompting AI. AI is incredibly good in data visualization – it’s like having a data science PhD in your team!
So, if having an inventory management dashboard is essential for your business, regardless of whether you’re in manufacturing, e-commerce, retail or logistics, then Five’s AI assistant is your best friend. But remember to crawl before you walk: first, let AI build the database. Then, let AI create an inventory management dashboard.
The Inventory Database Schema
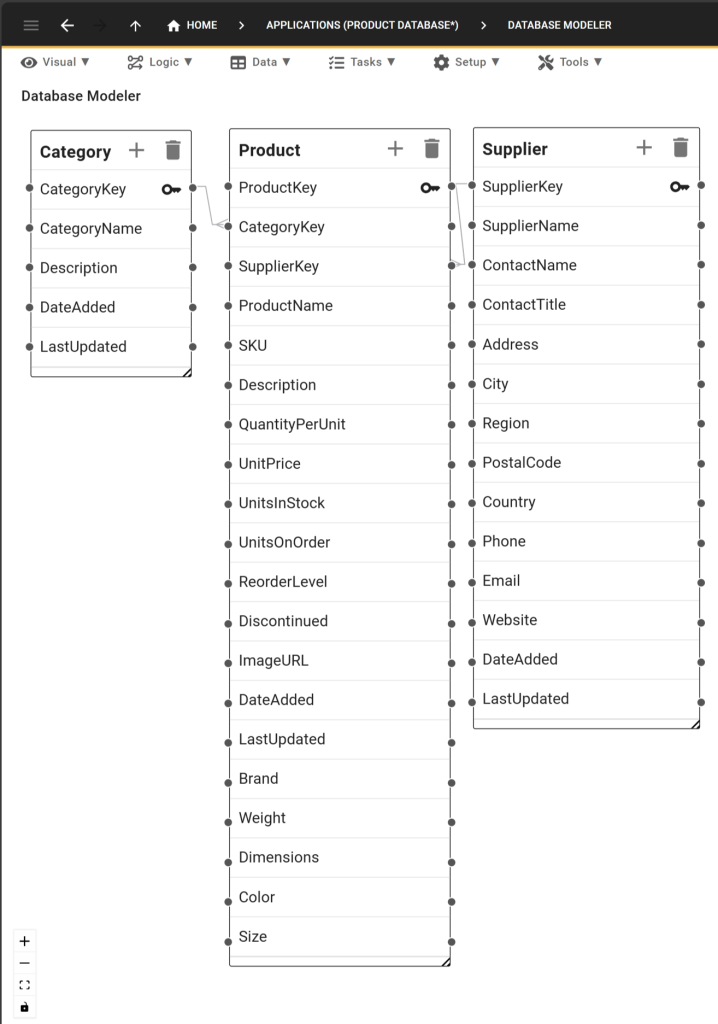
Here’s an AI generated inventory database schema. It consists of several interconnected tables:
- At its heart is the Product table, storing information about products and their attributes;
- The Category table helps us make sense of our products and the categories they belong to.
- The Supplier table is another critical piece of our database schema: it lets us associate products with suppliers and allows us to notify our business partners when inventory runs low.
Each table holds specific information, such as product, reorder levels, supplier contact details and product categories, ensuring a comprehensive and organized structure. The relationships between these tables facilitate efficient inventory management.
Get Started with Five Today
To build your inventory database with Five, sign up for a free trial to start the process. Once you have signed up, prompt AI to generate your database application. By following the steps mentioned above, you can create robust and scalable inventory database software tailored to your needs!
FAQs and Summary
FAQs
What is vibe coding for inventory management systems?
Vibe coding is a modern approach to software development where you use natural language and AI to describe the “vibe” or logic of an application. Instead of manual SQL coding, you provide a high-level prompt to an AI app generator like Five, which then builds the underlying database structure and relationships for you. In this way, you can create a full-fledged, tailor-made inventory management systems in minutes.
Can I really create a database with just one AI prompt?
Yes. By using a professionally engineered prompt that defines tables (like inventory, categories, suppliers or reorder levels) and their relationships, an AI-powered database builder can generate a fully functional schema in seconds. This eliminates hours of manual data modeling and table creation.
What information should be included in an inventory database prompt?
A robust inventory database prompt should specify key fields such as products, SKUs, descriptions, reorder levels, FIFO or LIFO, dimensions, weight, etc. The more detailed your prompt, the better the results!
Is an AI-generated inventory database secure?
When you use a professional tool like Five to generate your database, the AI handles the structural design (the schema), while the actual data remains hosted within a secure, managed environment. This gives you the speed of AI with the security of traditional relational database hosting.
Steps
How to Create an Inventory Database in One AI Prompt
Total Time: 5 minutes
Define Your Inventory Requirements
Identify the specific data points you need to track for effective inventory management, such as products, locations, shelves, expiration dates, etc.
Copy the “One-Click” AI Prompt
Use our professionally engineered sample prompt to describe your database structure to the AI.
Generate and Deploy in Five
Paste the prompt into the Five’s app generator to instantly build your tables and forms, then hit deploy to go live with your database application.
Supply:
- One AI Inventory Database Prompt
Tools:
- Five